Full Report
The numbers behind Doximity, Inc.: as-reported financial statements and company metrics for FY2022–FY2026, traced to the source filings, opened with the share-price history those statements have to justify. Every linked figure opens the exact page of the filing it was printed on, with the statement row highlighted. Amounts in US$ thousands unless noted.
Reading notes: All figures are as printed in Doximity's SEC filings, in thousands of US dollars (per-share and percentage rows excepted). Fiscal year ends March 31. FY2020 and FY2021 income-statement, EPS and operating-cash-flow figures in the Long-Term Record are the comparative columns of the FY2022 Form 10-K (Doximity's IPO 10-K); FY2020/FY2021 balance-sheet detail is not shown as the corpus 10-Ks print only two balance-sheet years. Income-statement line labels drift across years: the income-tax line is 'Provision for (benefit from) income taxes' through FY2024 and 'Provision for income taxes' thereafter; the restructuring line first appears in FY2024 ('Restructuring', 7,936), is 'Restructuring and impairment charges' in FY2025 (2,304) and nil in FY2026. Rows use the most descriptive label; each citation quote is verbatim to its own filing. Cash-flow investing/financing subtotal labels also drift ('Net cash used in …' vs 'Net cash provided by (used in) …'); quotes are verbatim per year.
Share Price — Full Available History — 5 Years
The stock closed at $21.77 on Jul 10, 2026 — down 59% over the window shown (-16.2% a year), trading between $18.01 and $102.02. At that close the stock trades at 22× FY2026 diluted EPS as reported below.
Source: market price feed, weekly closes, sampled from 1,266 source observations, Jun 2021–Jul 2026. Price return only, excludes dividends.
FY2026 at a Glance
Net income (US$ thousands)
Diluted EPS
Source: FY2026 consolidated statements [1] [2] [3] [4]. Click any linked figure to open the filing page with the row highlighted.
Revenue by Type
| Revenue by Type | FY2022 | FY2023 | FY2024 | FY2025 | FY2026 |
|---|---|---|---|---|---|
| Subscription | 319,298 | 389,739 | 450,071 | 543,770 | 608,413 |
| Other | 24,250 | 29,313 | 25,351 | 26,629 | 36,450 |
| Total revenue | 343,548 | 419,052 | 475,422 | 570,399 | 644,863 |
| Total revenue growth, derived | — | +22.0% | +13.5% | +20.0% | +13.1% |
Source: Revenue disaggregation footnote (Note 3 — Revenue), Form 10-K [5] [6] [7] [8]. Click any linked figure to open the filing page with the row highlighted.
Income Statement
Source: Consolidated Statements of Operations [1] [2] [3] [4]. Click any linked figure to open the filing page with the row highlighted.
Columns marked E are consensus analyst estimates shown alongside reported results for direct comparison; they are not company guidance.
Estimate source: Yahoo Finance analyst consensus, as of 2026-07-12. Estimate figures link to the consensus source, not to filing pages.
Balance Sheet
Source: Consolidated Balance Sheets [9] [10] [11] [12]. Click any linked figure to open the filing page with the row highlighted.
Cash Flow
Source: Consolidated Statements of Cash Flows [13] [14] [15] [16]. Click any linked figure to open the filing page with the row highlighted.
Profitability Cash Generation (non-GAAP)
| Profitability Cash Generation (non-GAAP) | FY2022 | FY2023 | FY2024 | FY2025 | FY2026 |
|---|---|---|---|---|---|
| Adjusted EBITDA | 150,272 | 183,983 | 230,460 | 313,829 | 357,816 |
| Adjusted EBITDA margin | 44.0% | 44.0% | 48.0% | 55.0% | 55.0% |
| Net income margin | 45.0% | 27.0% | 31.0% | 39.0% | 30.0% |
| Free cash flow | 120,878 | 173,418 | 178,295 | 266,740 | 317,495 |
Source: company filings [17] [18] [19] [20]. Click any linked figure to open the filing page with the row highlighted.
Network Reach Retention
| Network Reach Retention | FY2022 | FY2023 | FY2024 | FY2025 | FY2026 |
|---|---|---|---|---|---|
| Net revenue retention rate | 157.0% | 117.0% | 114.0% | 119.0% | 109.0% |
| Registered members (period end) | 2,000,000 | 2,000,000 | 2,000,000 | 2,000,000 | 3,000,000 |
| Registered members as % of U.S. physicians | 80.0% | 80.0% | 80.0% | 80.0% | 85.0% |
Source: company filings [21] [22] [23] [24]. Click any linked figure to open the filing page with the row highlighted.
Stock-Based Compensation by Function
| Stock-Based Compensation by Function | FY2022 | FY2023 | FY2024 | FY2025 | FY2026 |
|---|---|---|---|---|---|
| Cost of revenue | 4,979 | 9,634 | 9,479 | 11,001 | 11,680 |
| Research and development | 7,065 | 12,583 | 11,978 | 19,394 | 46,159 |
| Sales and marketing | 8,108 | 16,939 | 16,857 | 26,323 | 39,397 |
| General and administrative | 11,290 | 8,678 | 9,116 | 15,668 | 24,391 |
| Total stock-based compensation expense | 31,442 | 47,834 | 51,076 | 72,386 | 121,627 |
Source: company filings [25] [26] [27] [28]. Click any linked figure to open the filing page with the row highlighted.
Long-Term Record
| Fiscal year | Total revenue | Income from operations | Net income | Diluted net income per share | Net cash provided by operating activities |
|---|---|---|---|---|---|
| FY2020 | 116,388 | 22,163 | 29,737 | 0.13 | 26,199 |
| FY2021 | 206,897 | 53,303 | 50,210 | 0.23 | 82,973 |
| FY2022 | 343,548 | 113,536 | 154,783 | 0.70 | 126,575 |
| FY2023 | 419,052 | 125,108 | 112,818 | 0.53 | 179,602 |
| FY2024 | 475,422 | 163,878 | 147,582 | 0.72 | 184,096 |
| FY2025 | 570,399 | 227,800 | 223,185 | 1.11 | 273,265 |
| FY2026 | 644,863 | 214,920 | 196,051 | 0.98 | 326,458 |
Source: consolidated statements across filings; older years from the standardized feed [13] [1] [14] [2]. Click any linked figure to open the filing page with the row highlighted.
Operating KPIs
| KPI | FY2022 | FY2023 | FY2024 | FY2025 | FY2026 |
|---|---|---|---|---|---|
| Net revenue retention rate | 157% | 117% | 114% | 119% | 109% |
| Customers with at least $500,000 of revenue | — | — | 98 | 116 | 125 |
| Customers with at least $100,000 of revenue | 265 | 294 | 296 | — | — |
Source: company-reported operating metrics [21] [23] [29] [30]. Click any linked figure to open the filing page with the row highlighted.
Analyst Consensus
Current price
Mean target
Median target
High target
Low target
Estimate source: Yahoo Finance analyst consensus, as of 2026-07-12. Estimate figures link to the consensus source, not to filing pages.
Traceability
350 of 354 figures on this page (99%) link to the filing page where they are printed — click a linked figure to open the source PDF at that page with the row highlighted. Unlinked figures come from standardized data feeds or pre-filing years.
All figures are as printed in Doximity's SEC filings, in thousands of US dollars (per-share and percentage rows excepted). Fiscal year ends March 31.
FY2020 and FY2021 income-statement, EPS and operating-cash-flow figures in the Long-Term Record are the comparative columns of the FY2022 Form 10-K (Doximity's IPO 10-K); FY2020/FY2021 balance-sheet detail is not shown as the corpus 10-Ks print only two balance-sheet years.
Income-statement line labels drift across years: the income-tax line is 'Provision for (benefit from) income taxes' through FY2024 and 'Provision for income taxes' thereafter; the restructuring line first appears in FY2024 ('Restructuring', 7,936), is 'Restructuring and impairment charges' in FY2025 (2,304) and nil in FY2026. Rows use the most descriptive label; each citation quote is verbatim to its own filing.
Cash-flow investing/financing subtotal labels also drift ('Net cash used in …' vs 'Net cash provided by (used in) …'); quotes are verbatim per year.
Doximity carries no debt; the balance sheet shows no borrowings. The company's real reinvestment runs through 'Internal-use software development costs' (shown in the cash-flow statement) rather than purchases of property and equipment, which are negligible.
The ≥$100,000-revenue customer metric was disclosed through the FY2024 10-K and discontinued thereafter; the ≥$500,000 metric was introduced in the FY2024 10-K. Net revenue retention is disclosed every year.
Quarterly cash flow: single quarters are derived from the printed year-to-date statements (see the statement note); every derived value reconciles exactly to two printed year-to-date figures and was cross-checked against the quarterly data feed.
Quarterly Q4 income columns (Q4 FY25, Q4 FY26) are derived as full-year (10-K) minus nine-month year-to-date (Q3 10-Q); diluted EPS is left blank for Q4 because per-share amounts are not additive.
1 figure(s) differed between the data feed and the filing; the filing value is shown (see the run's metrics/metrics_tab.json for the audit trail).
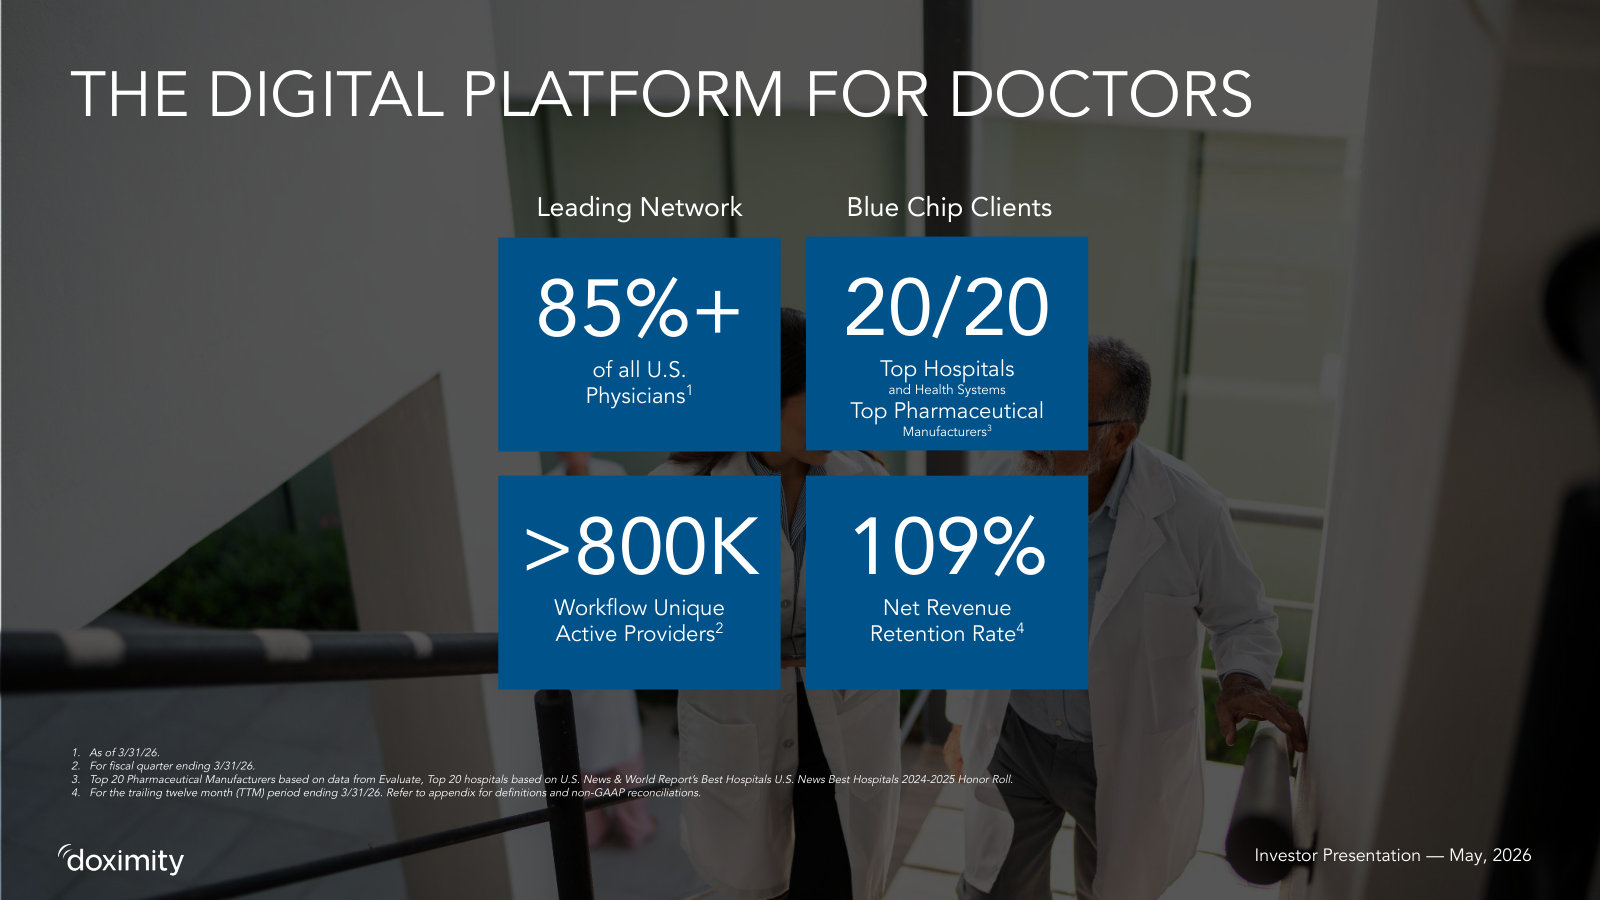
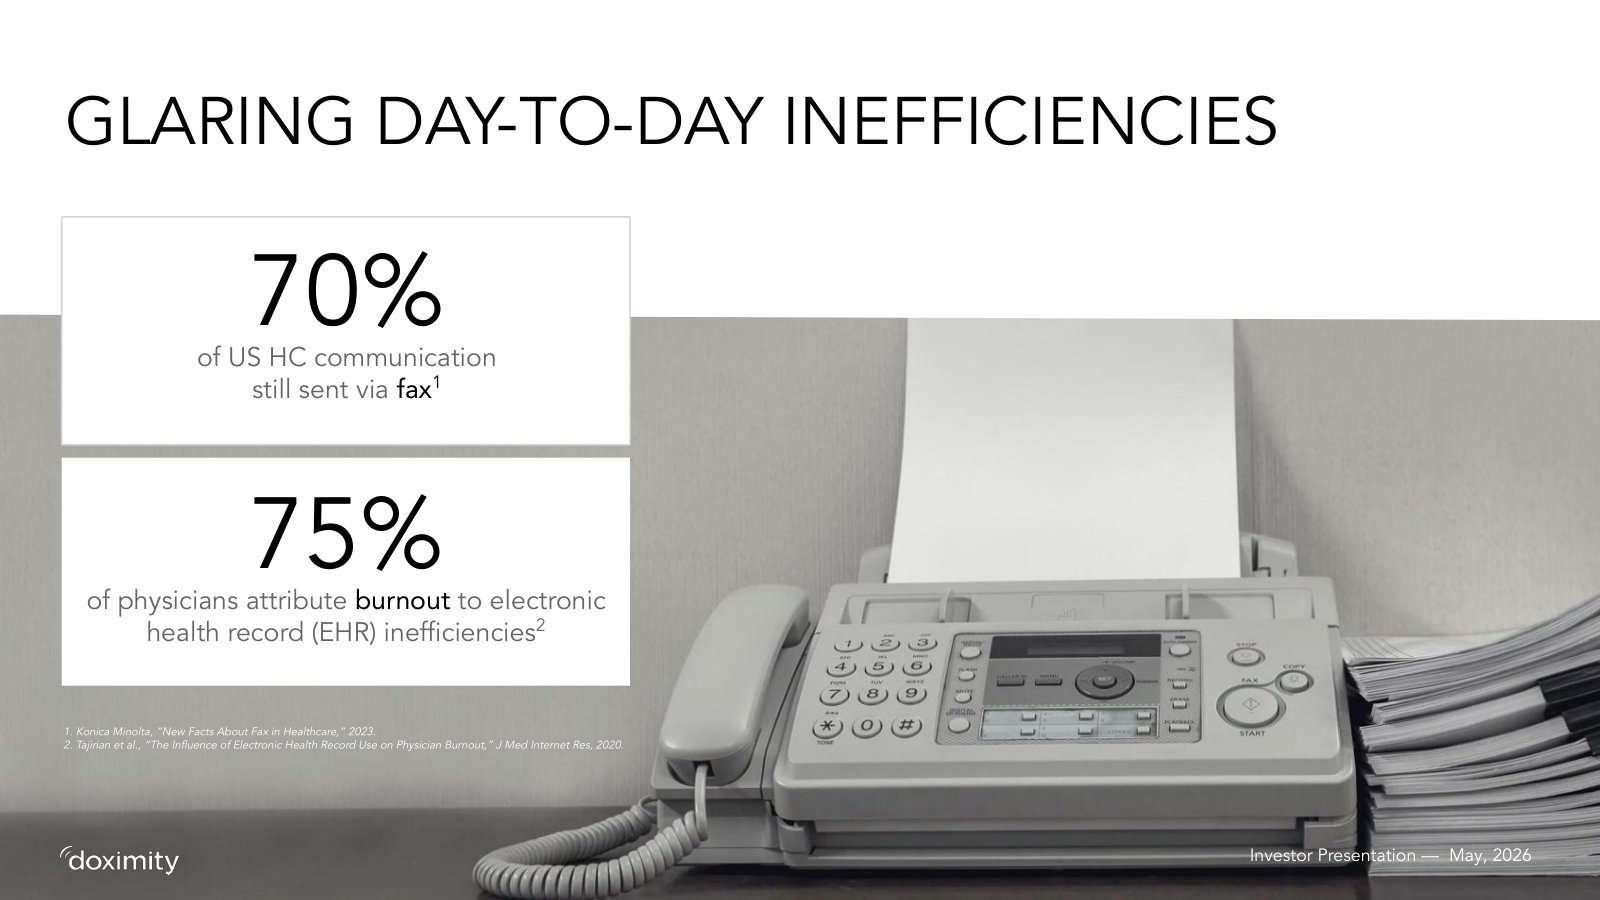
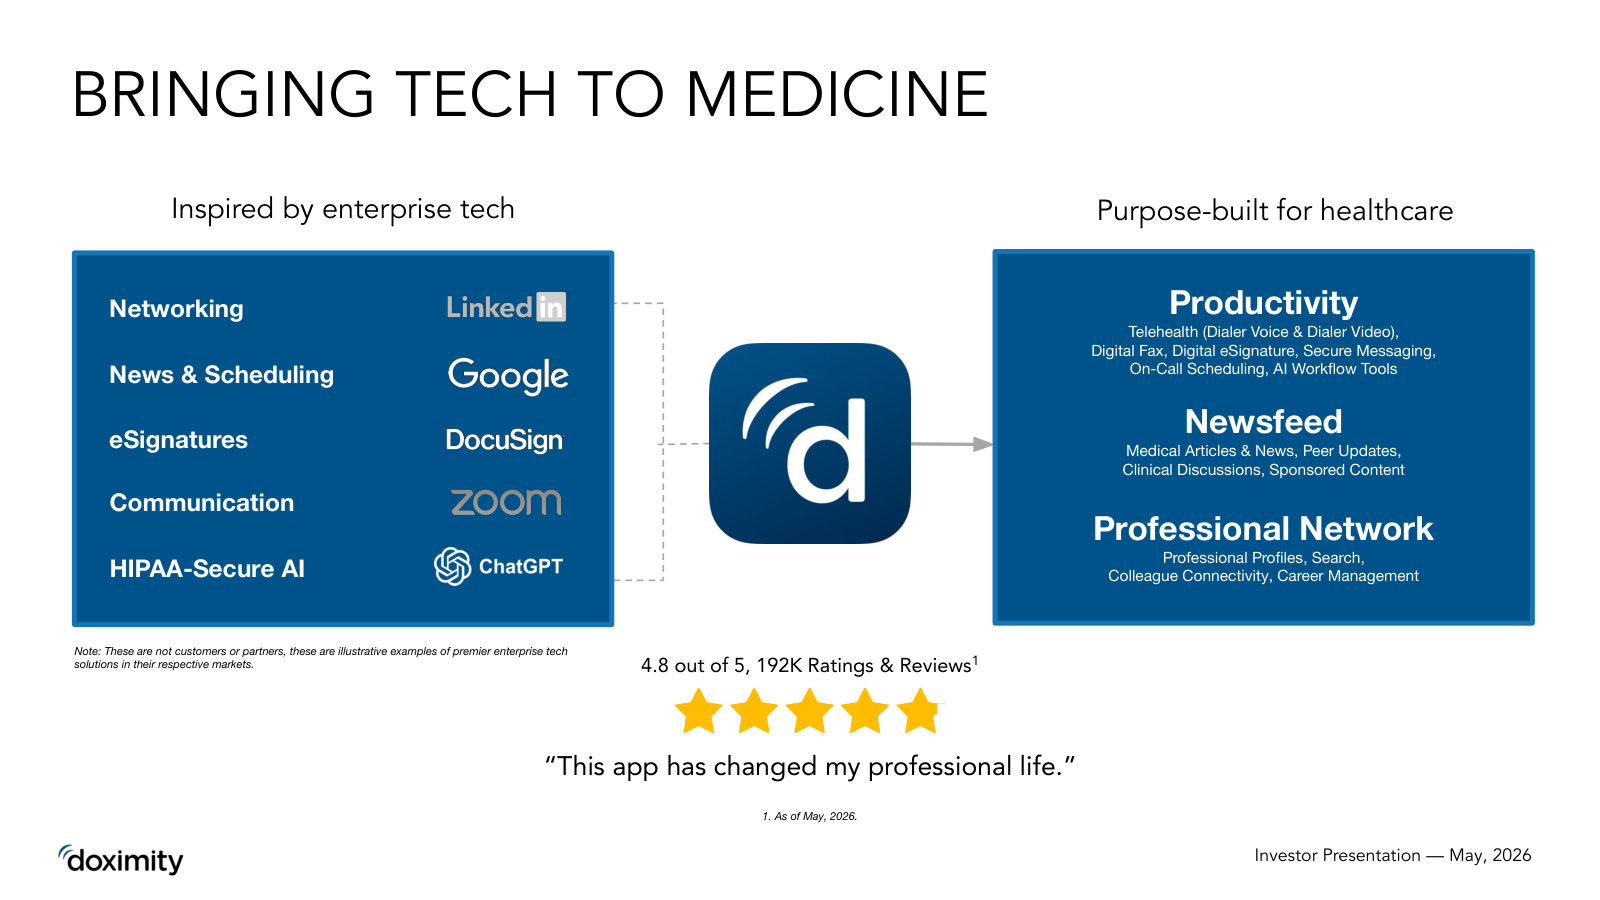
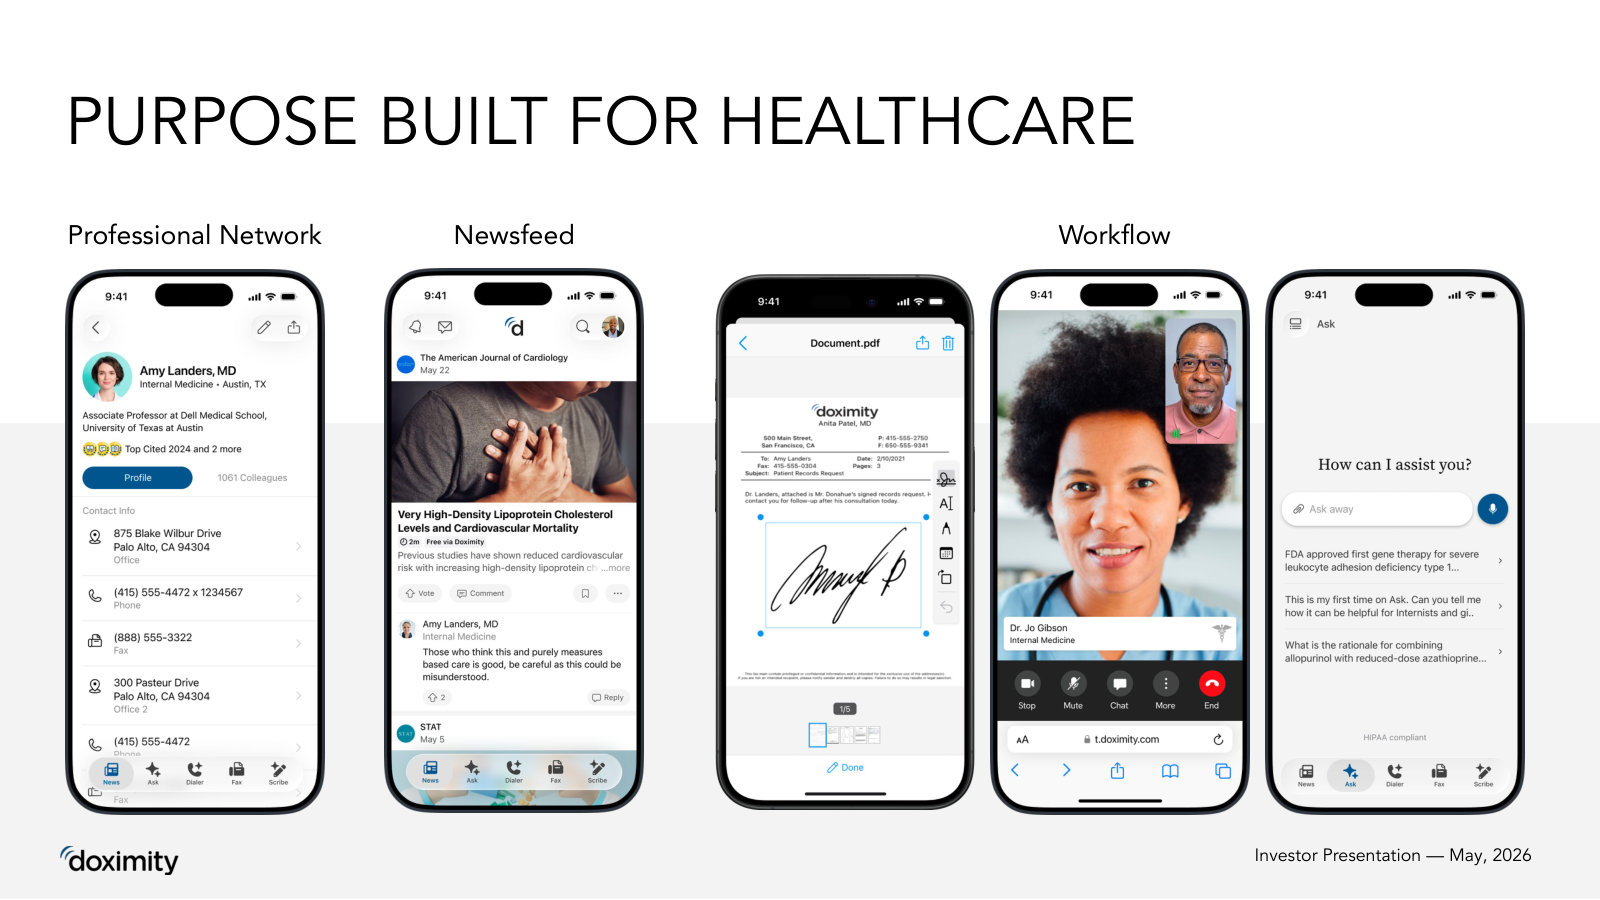
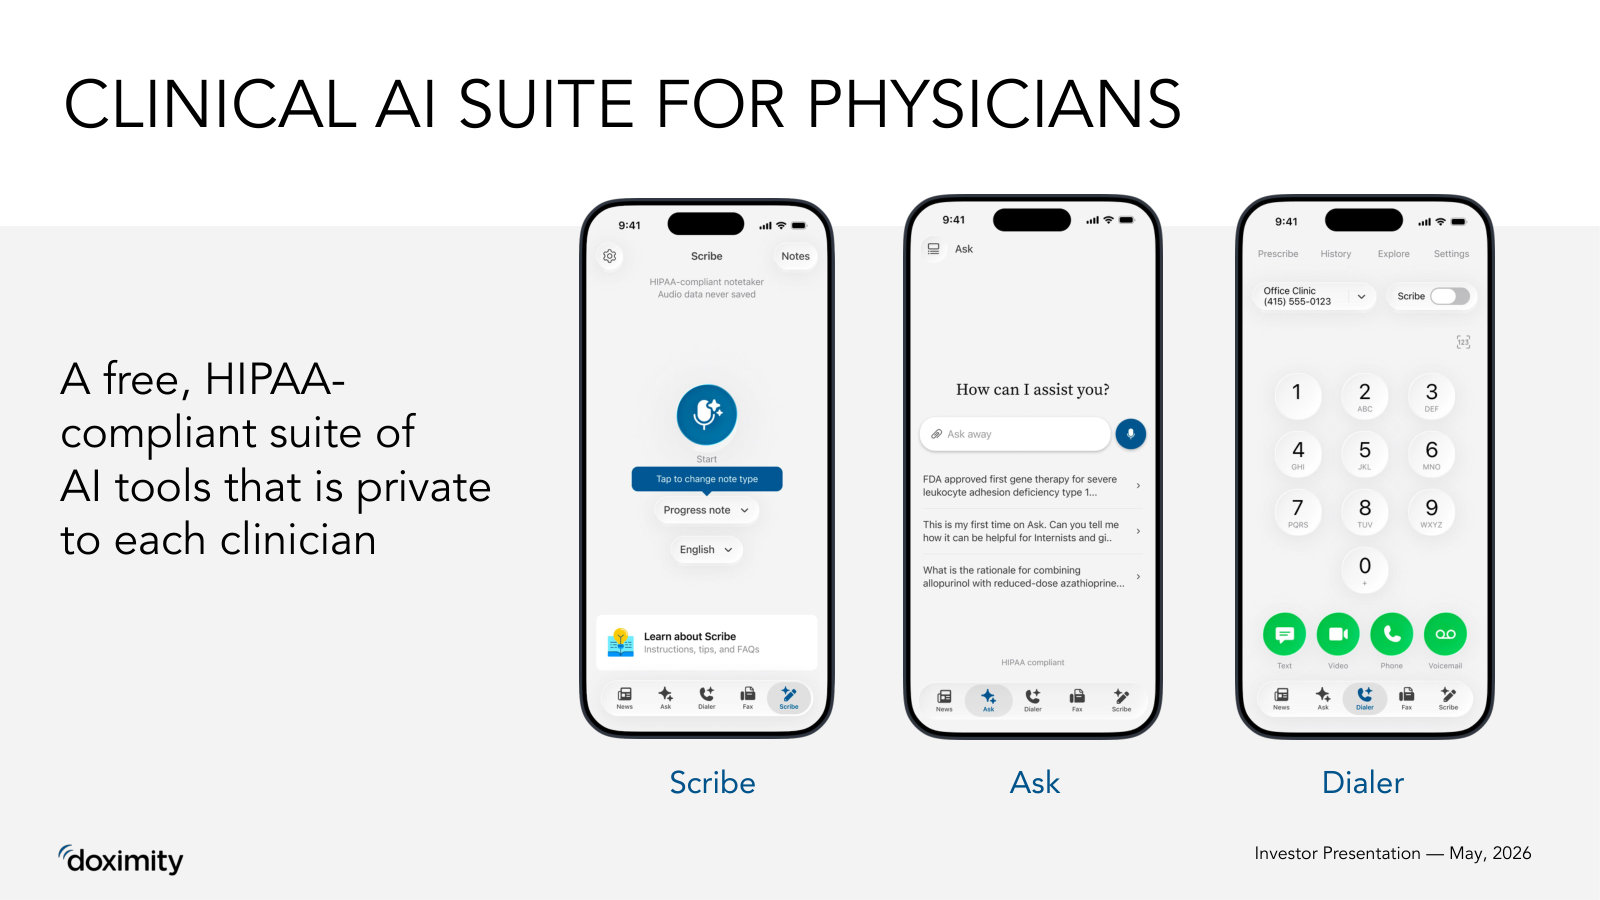
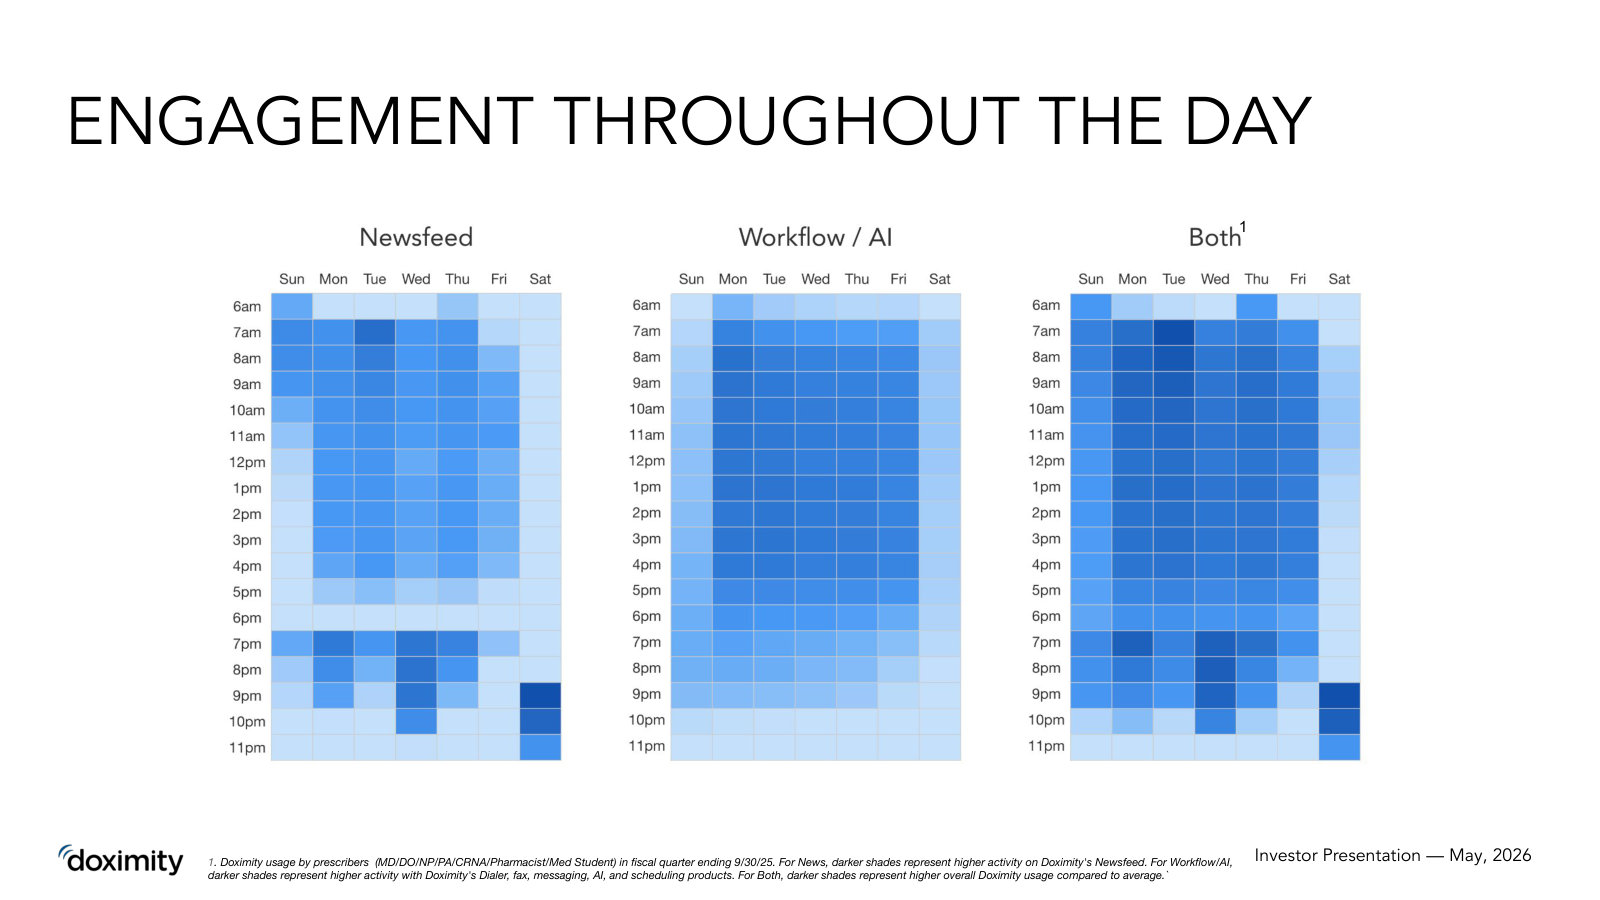
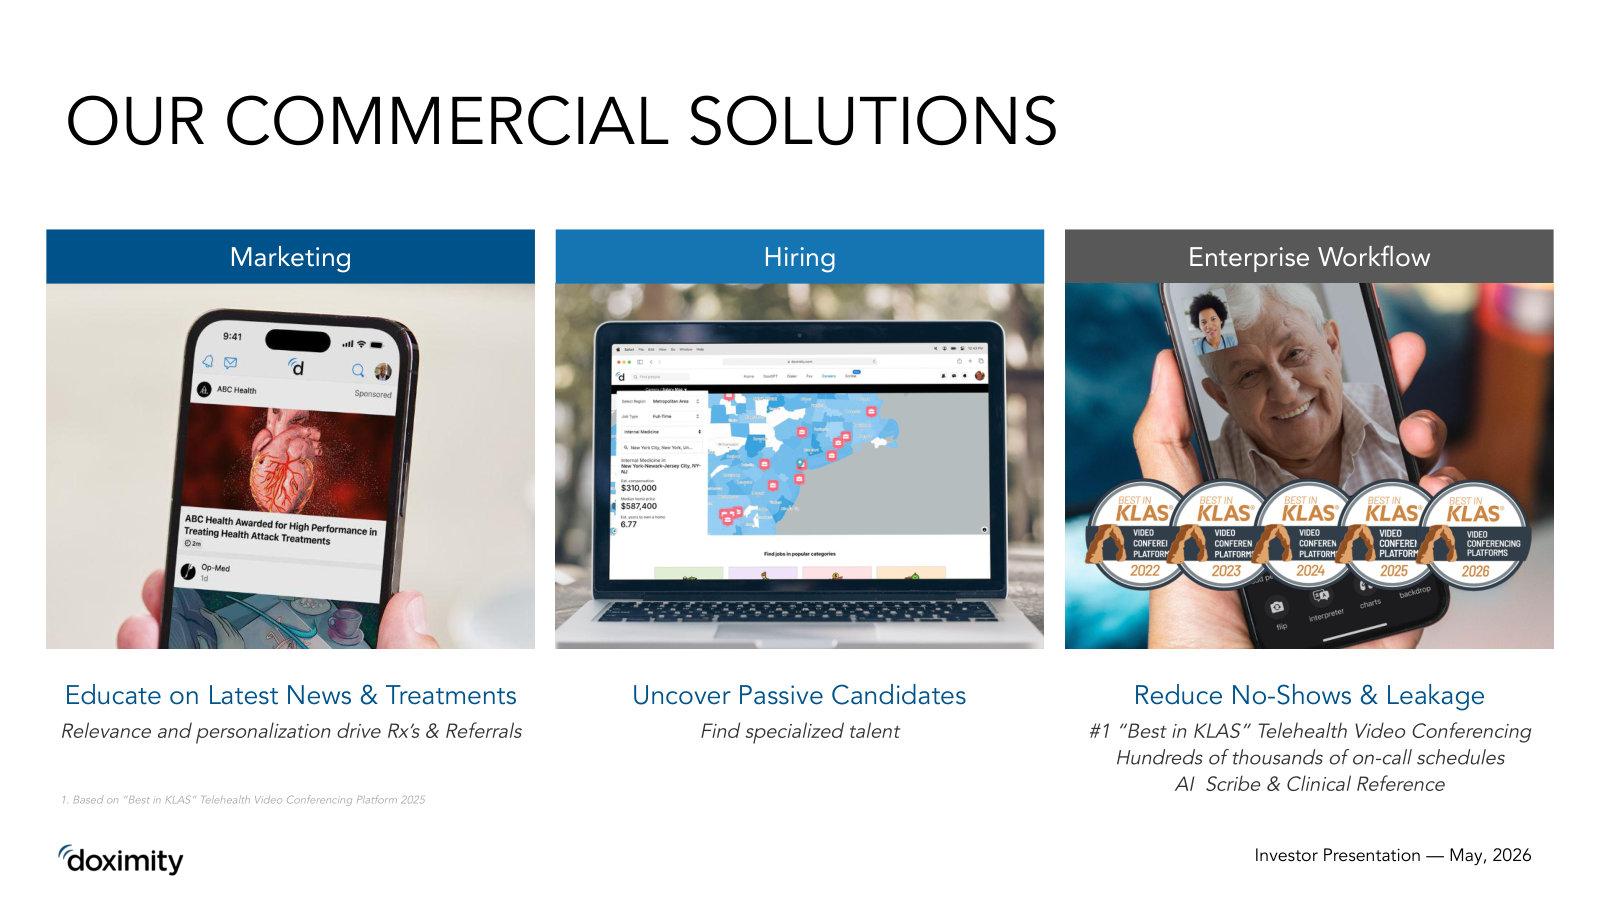
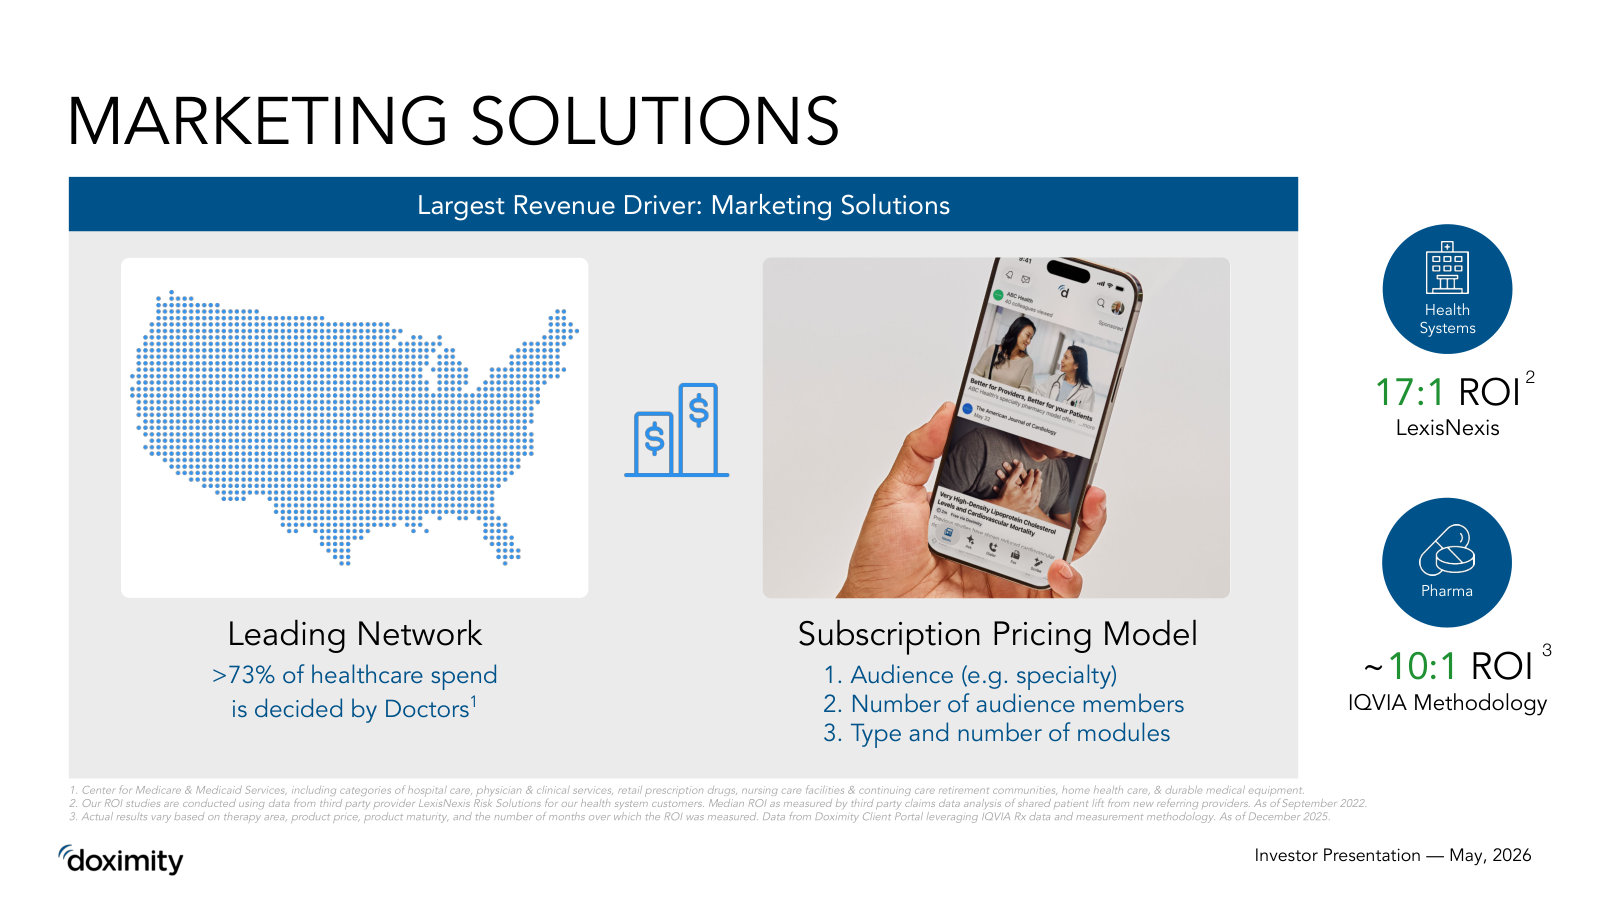
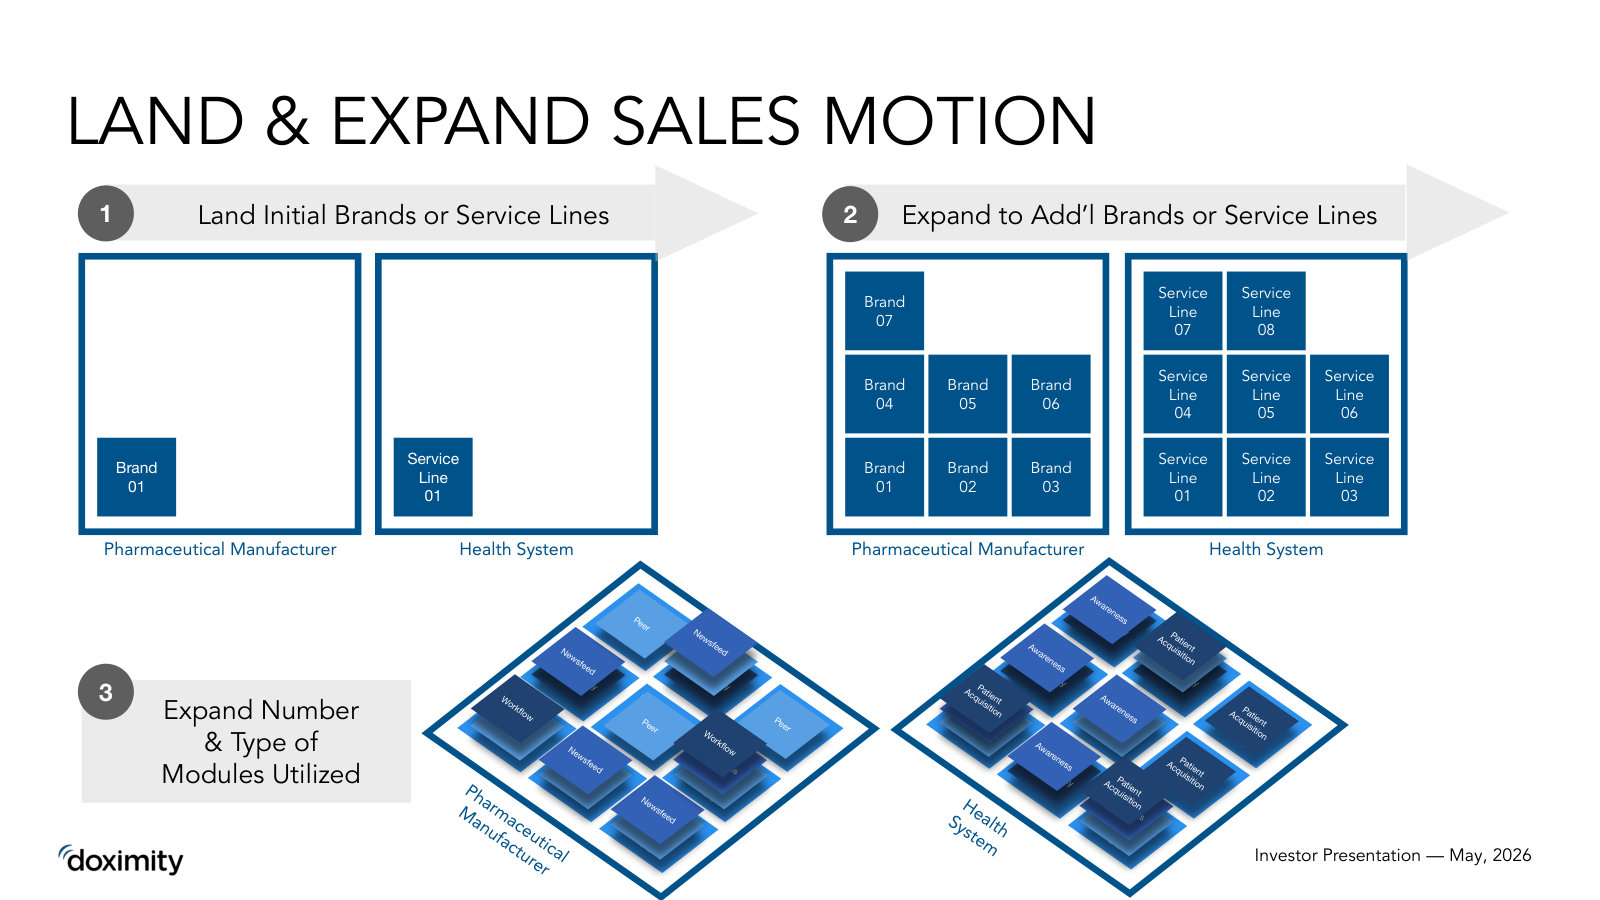
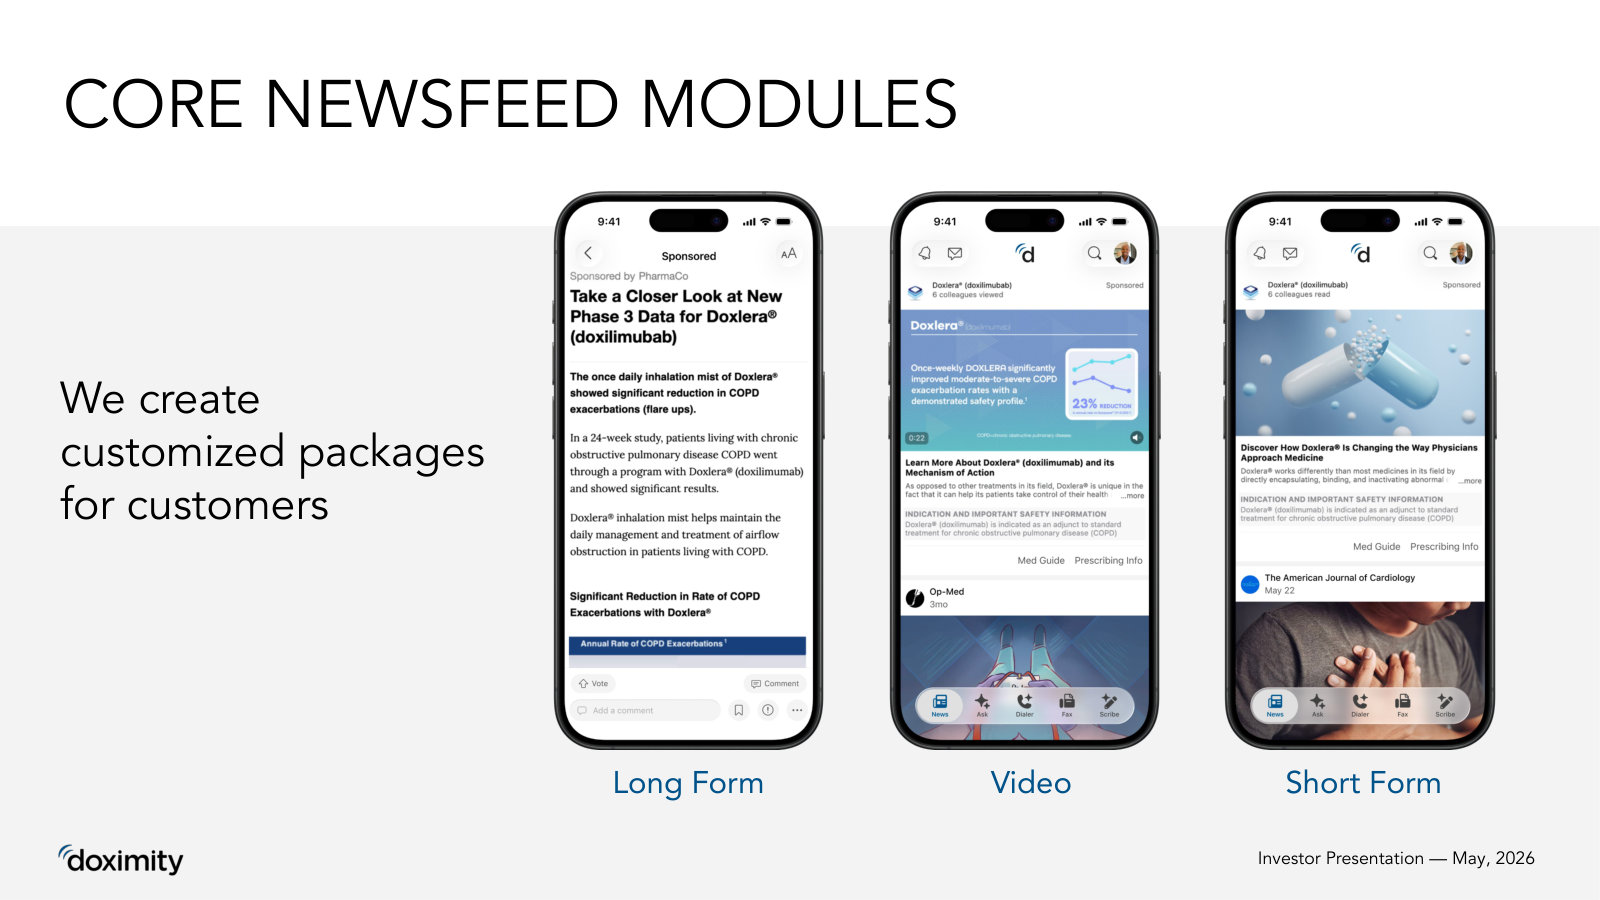
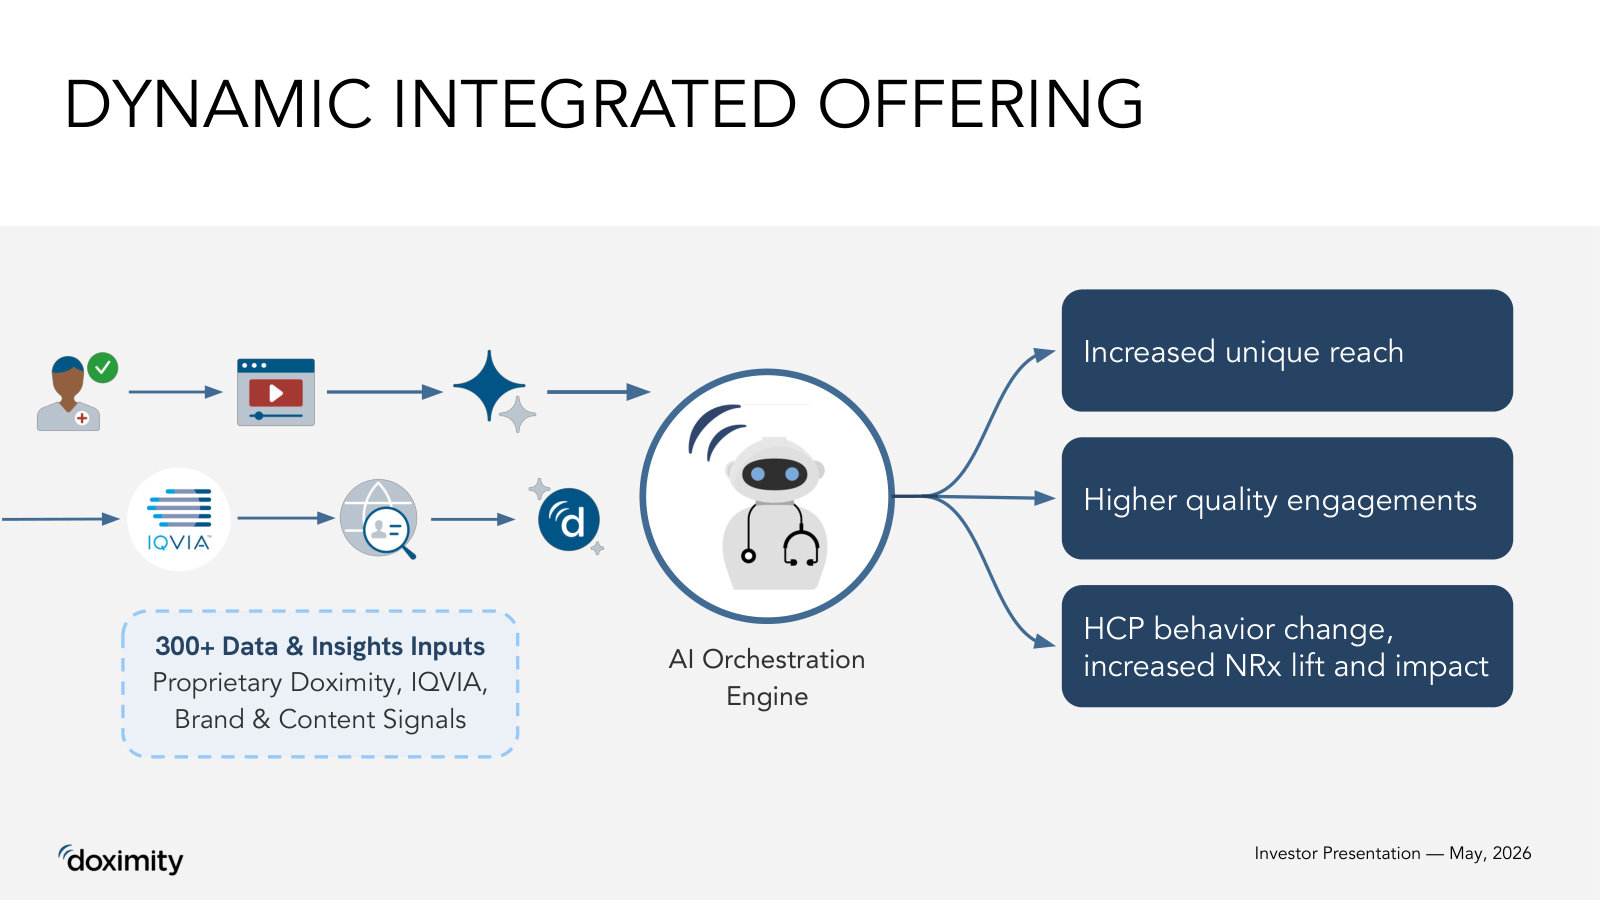
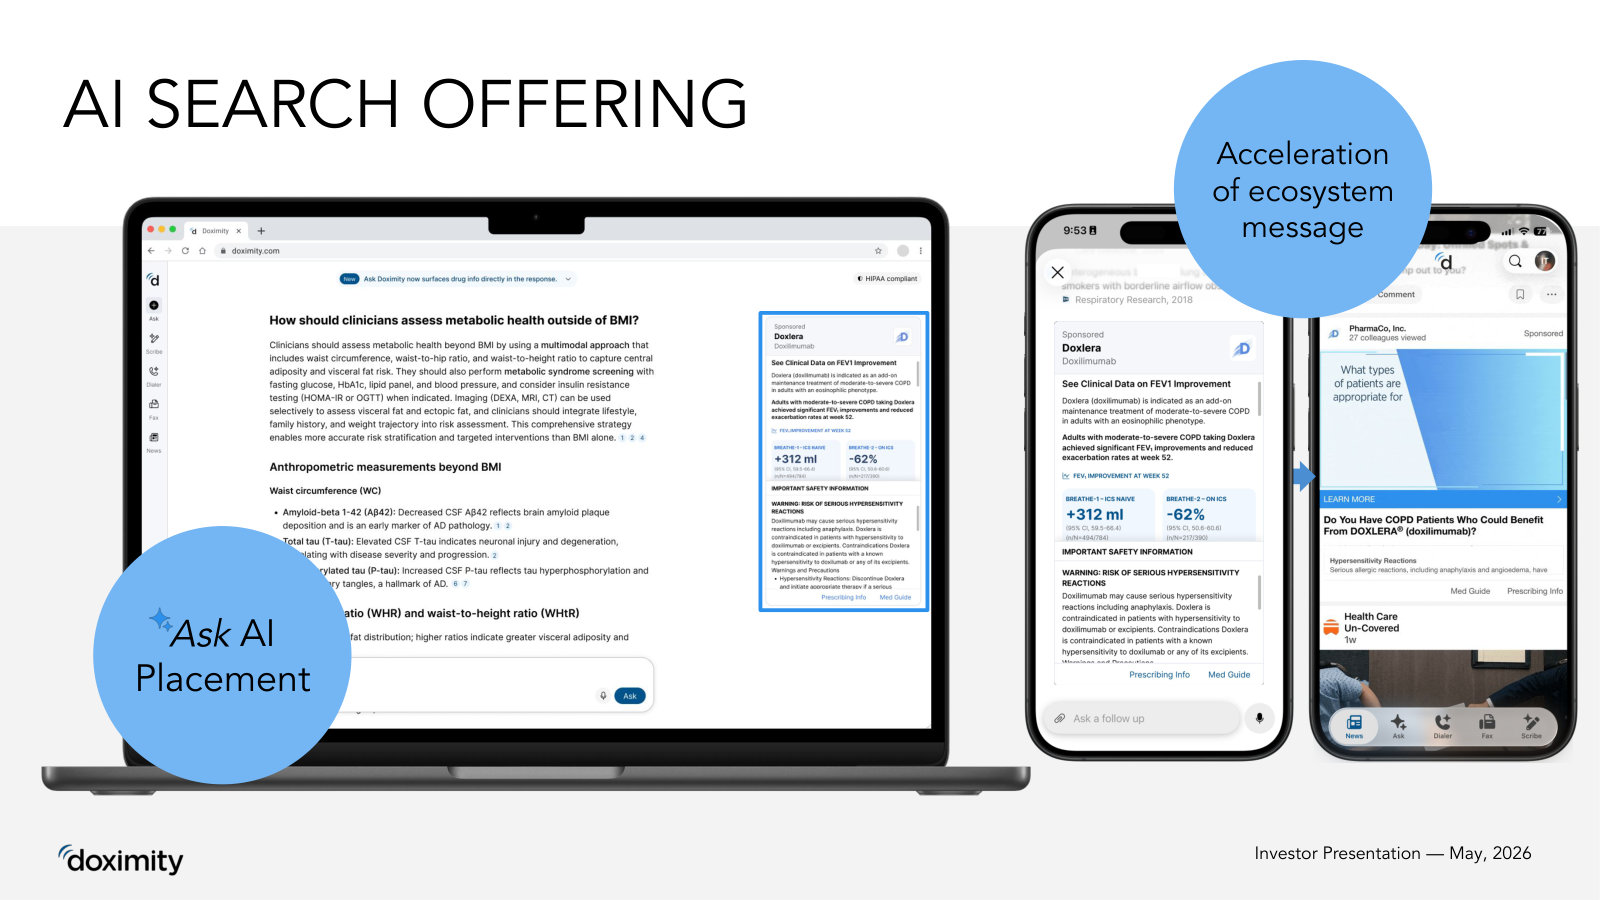
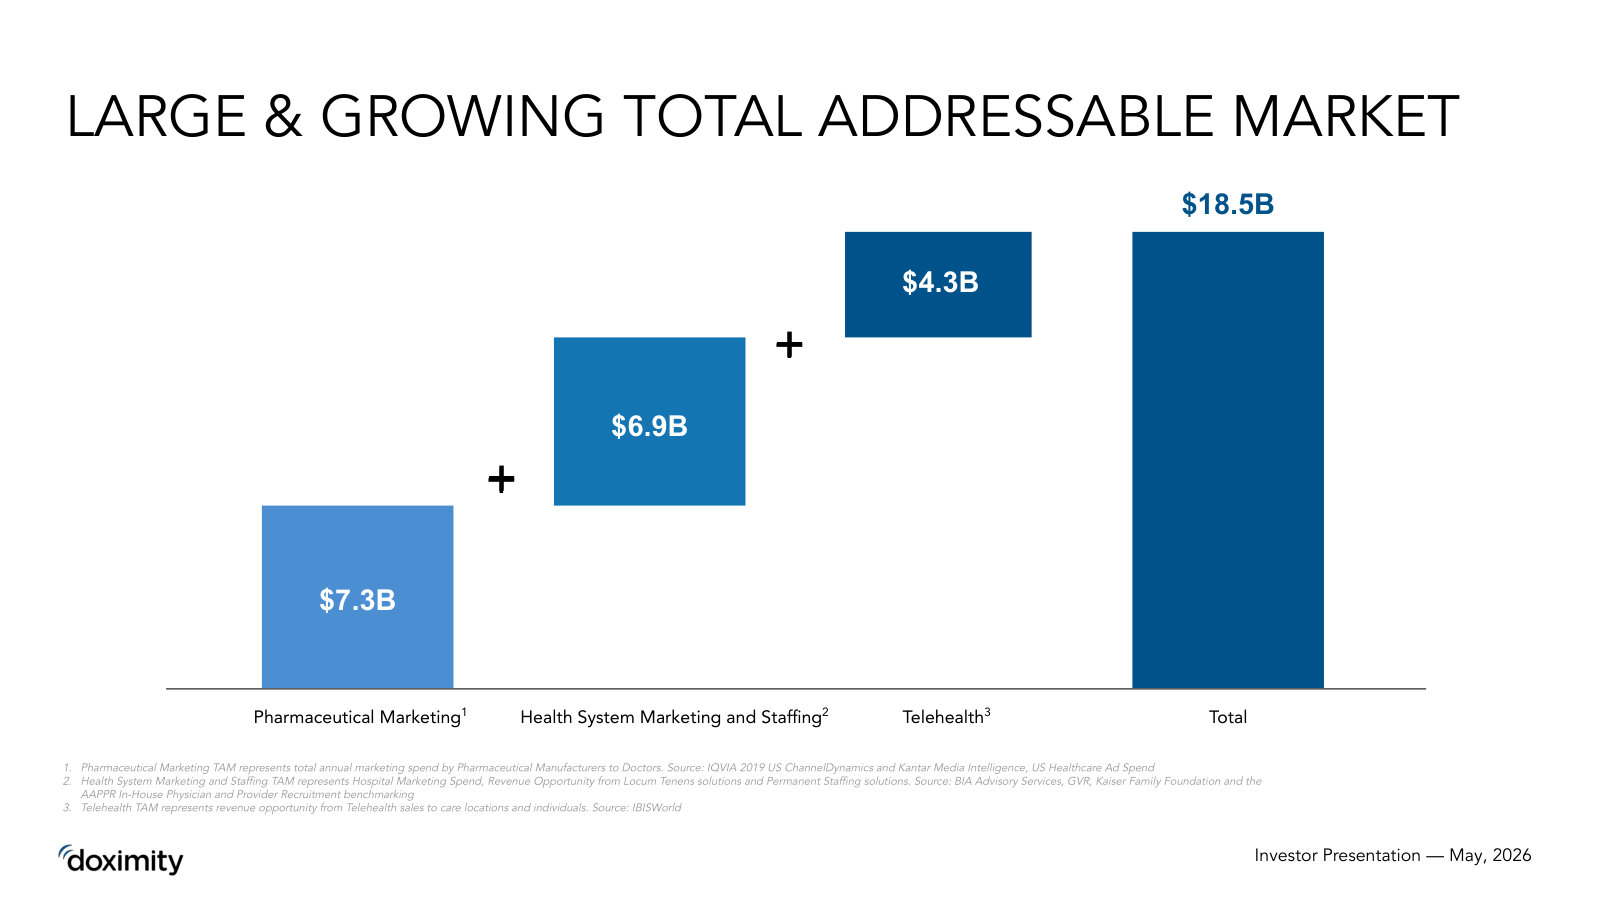
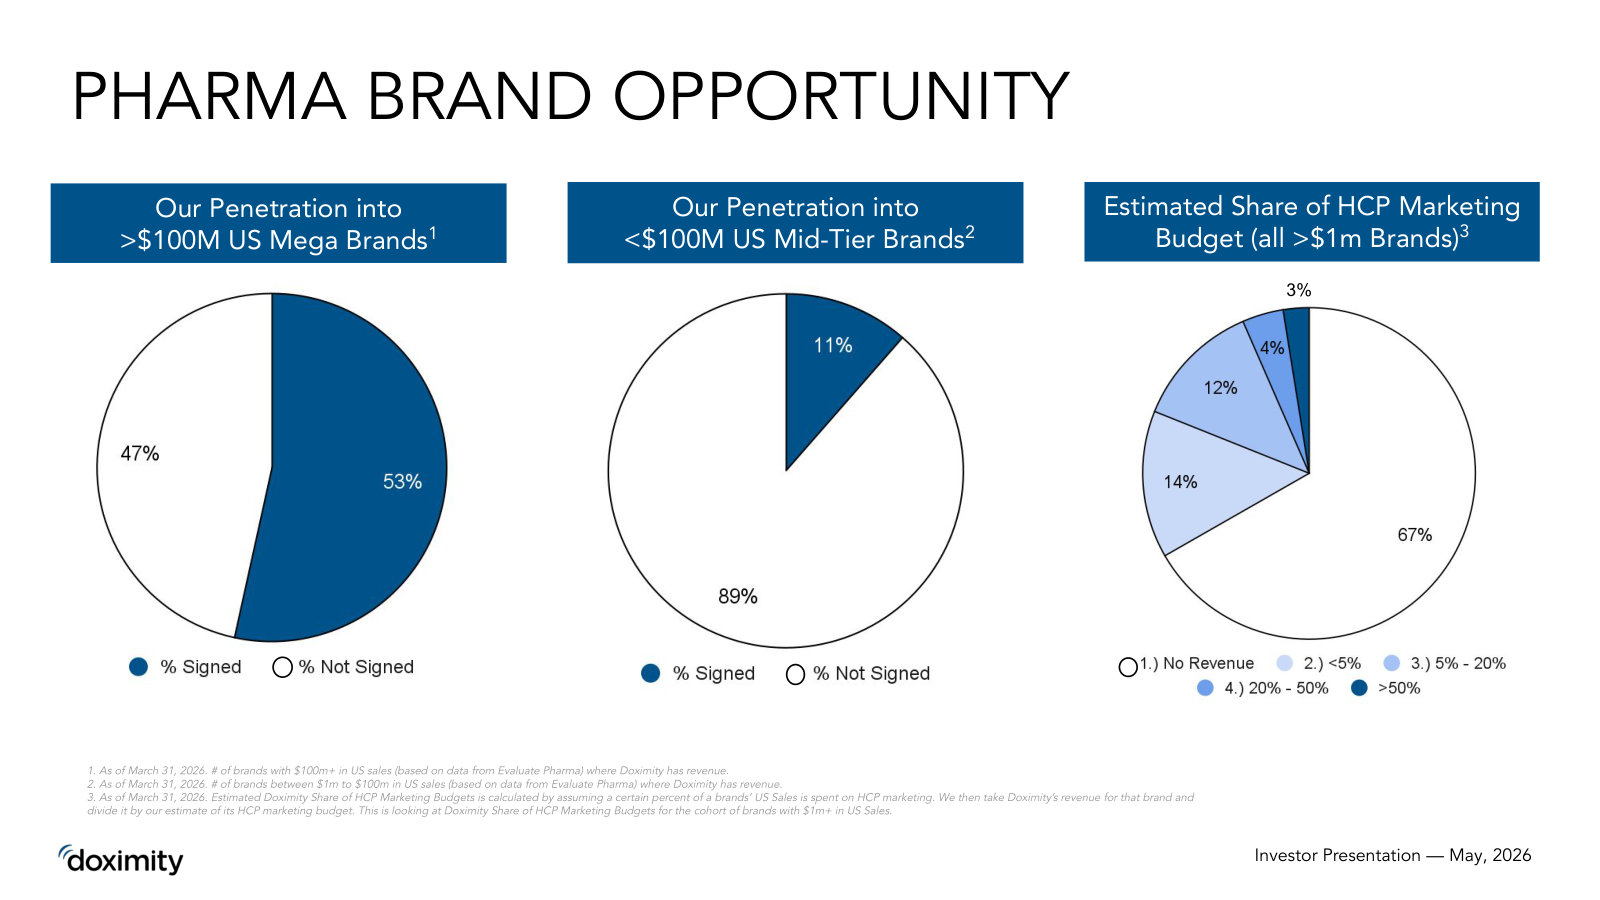
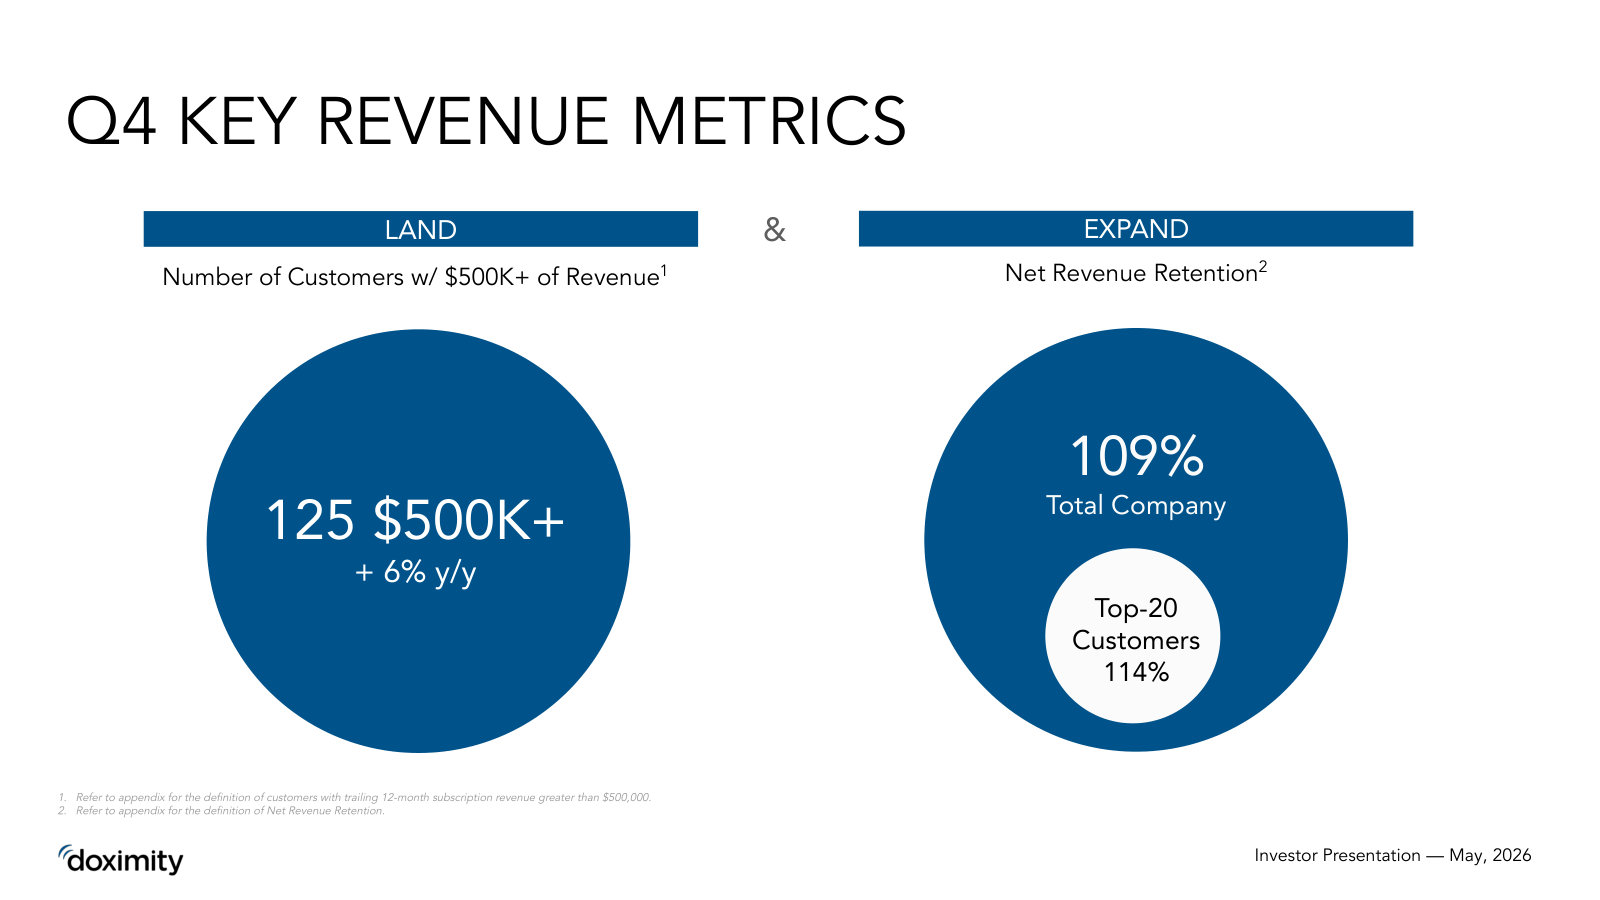
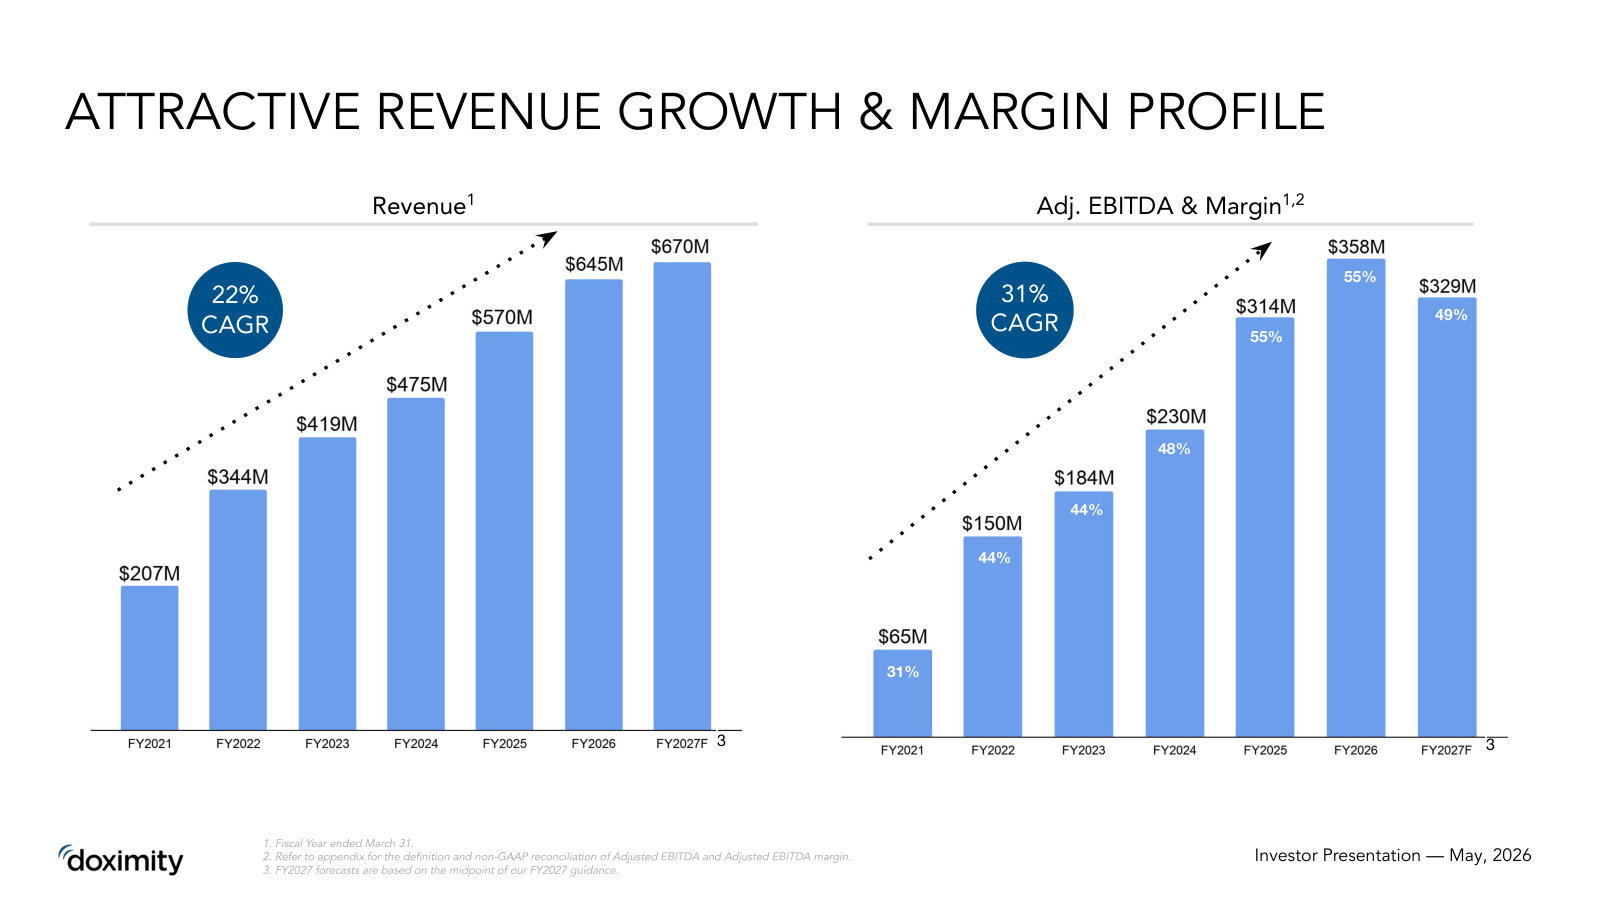
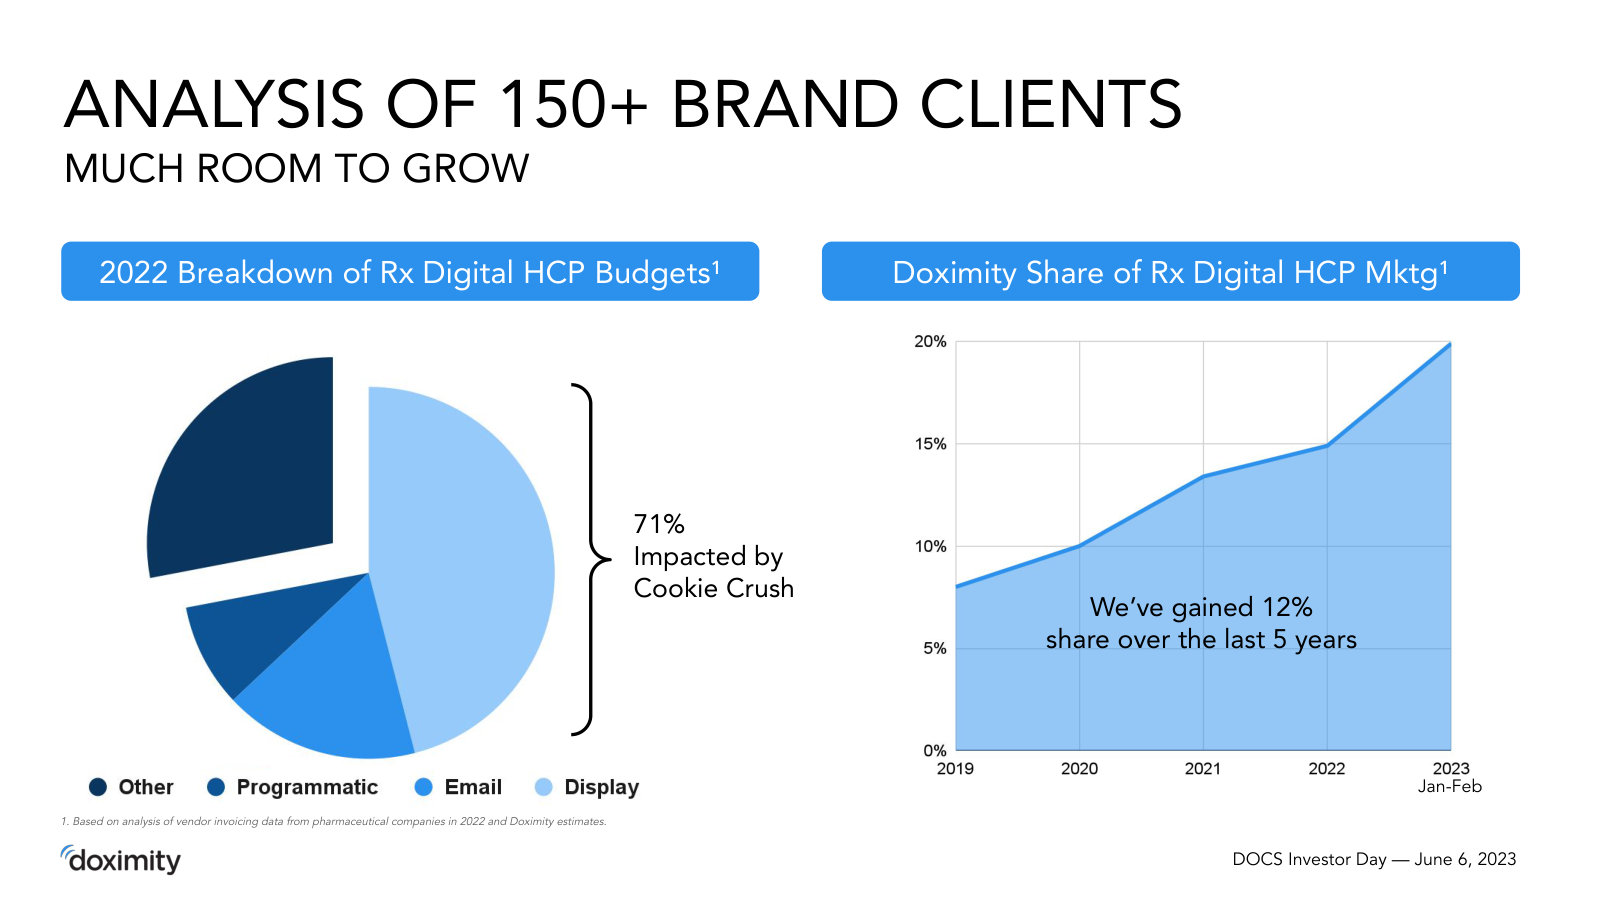
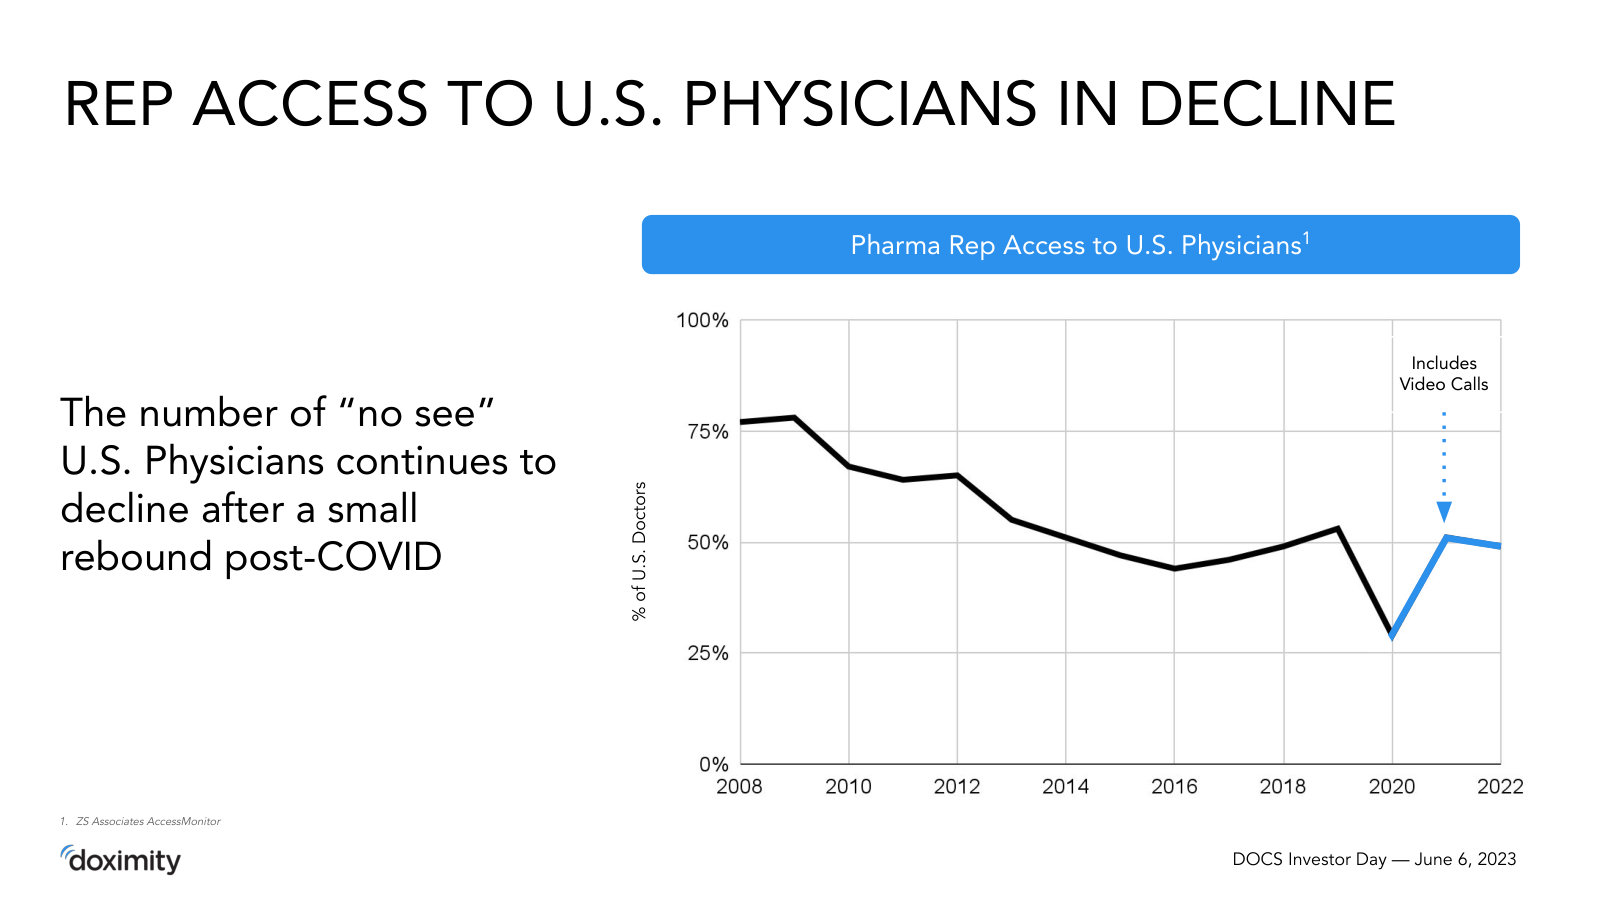
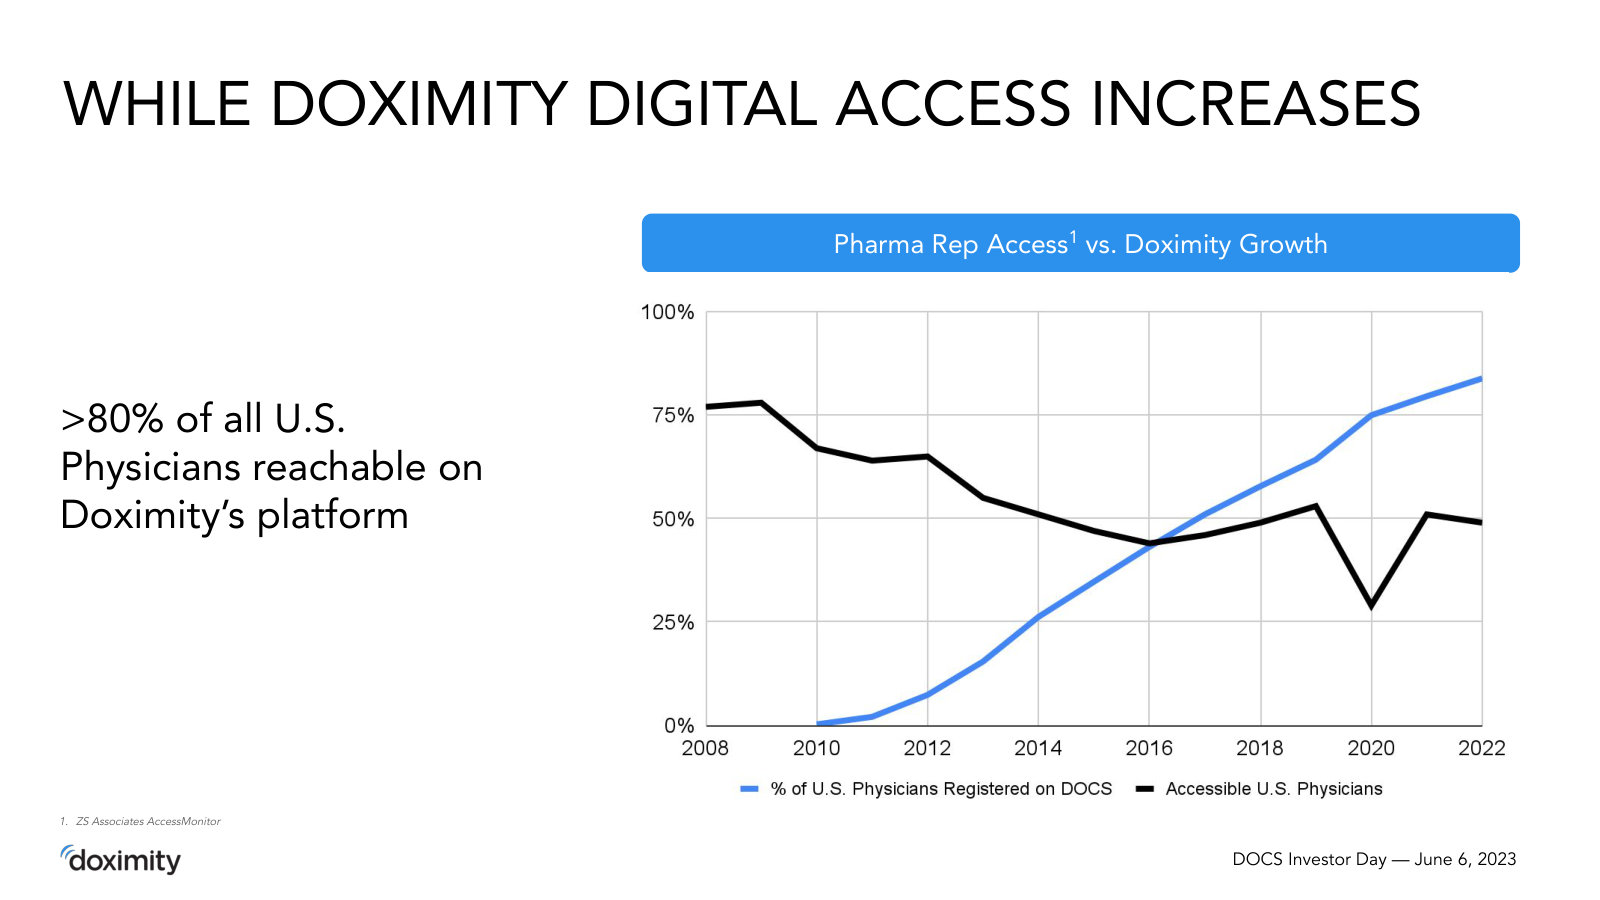
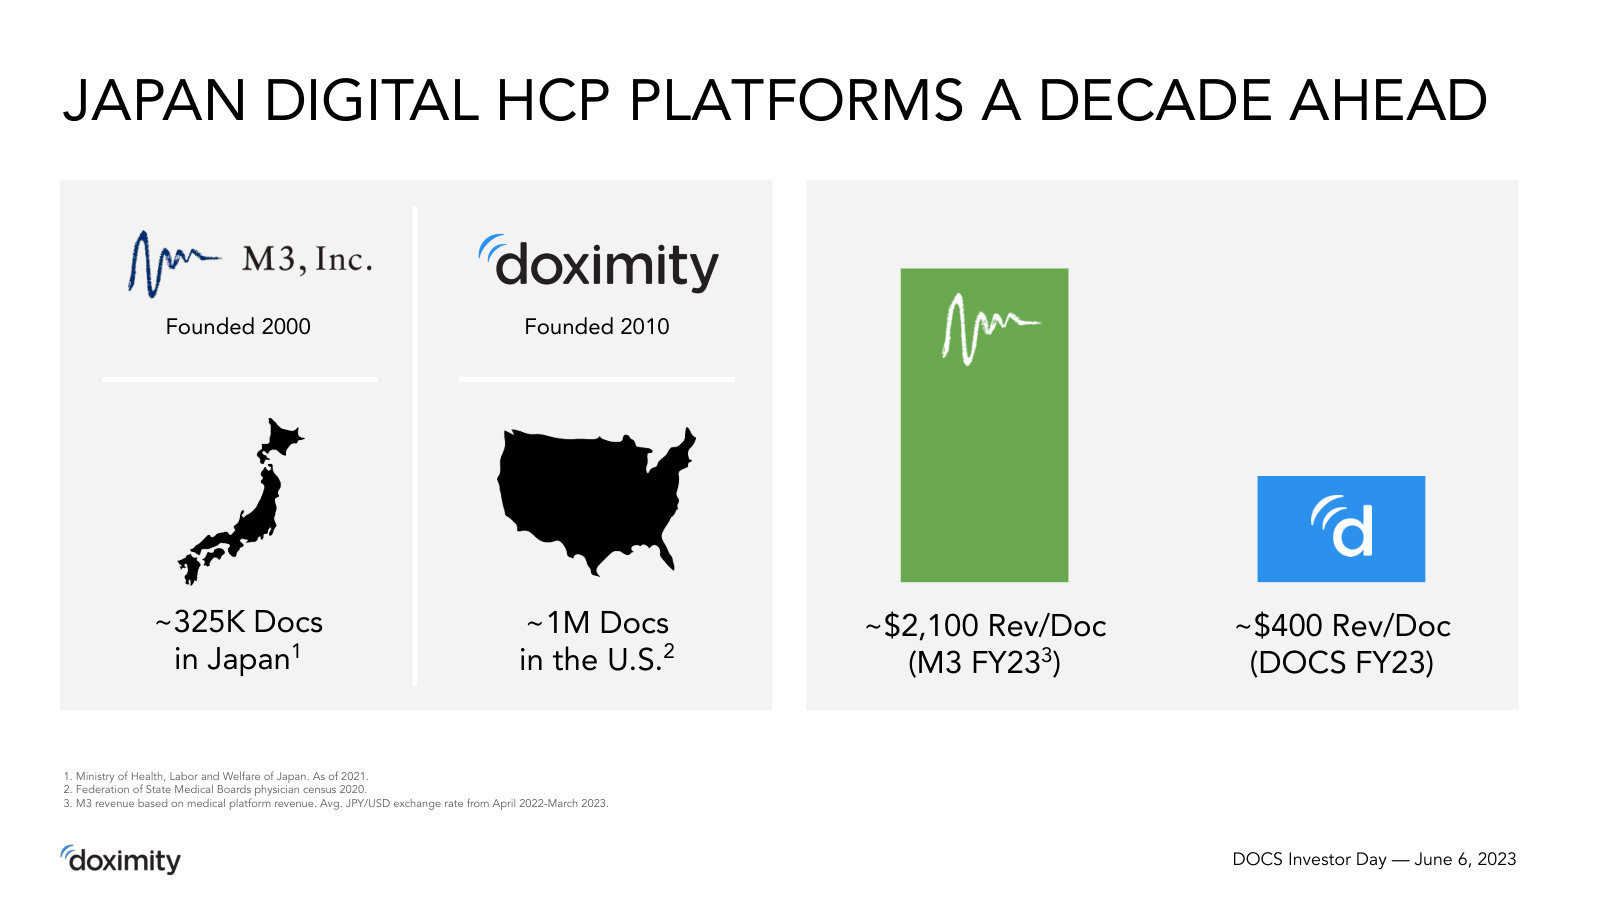
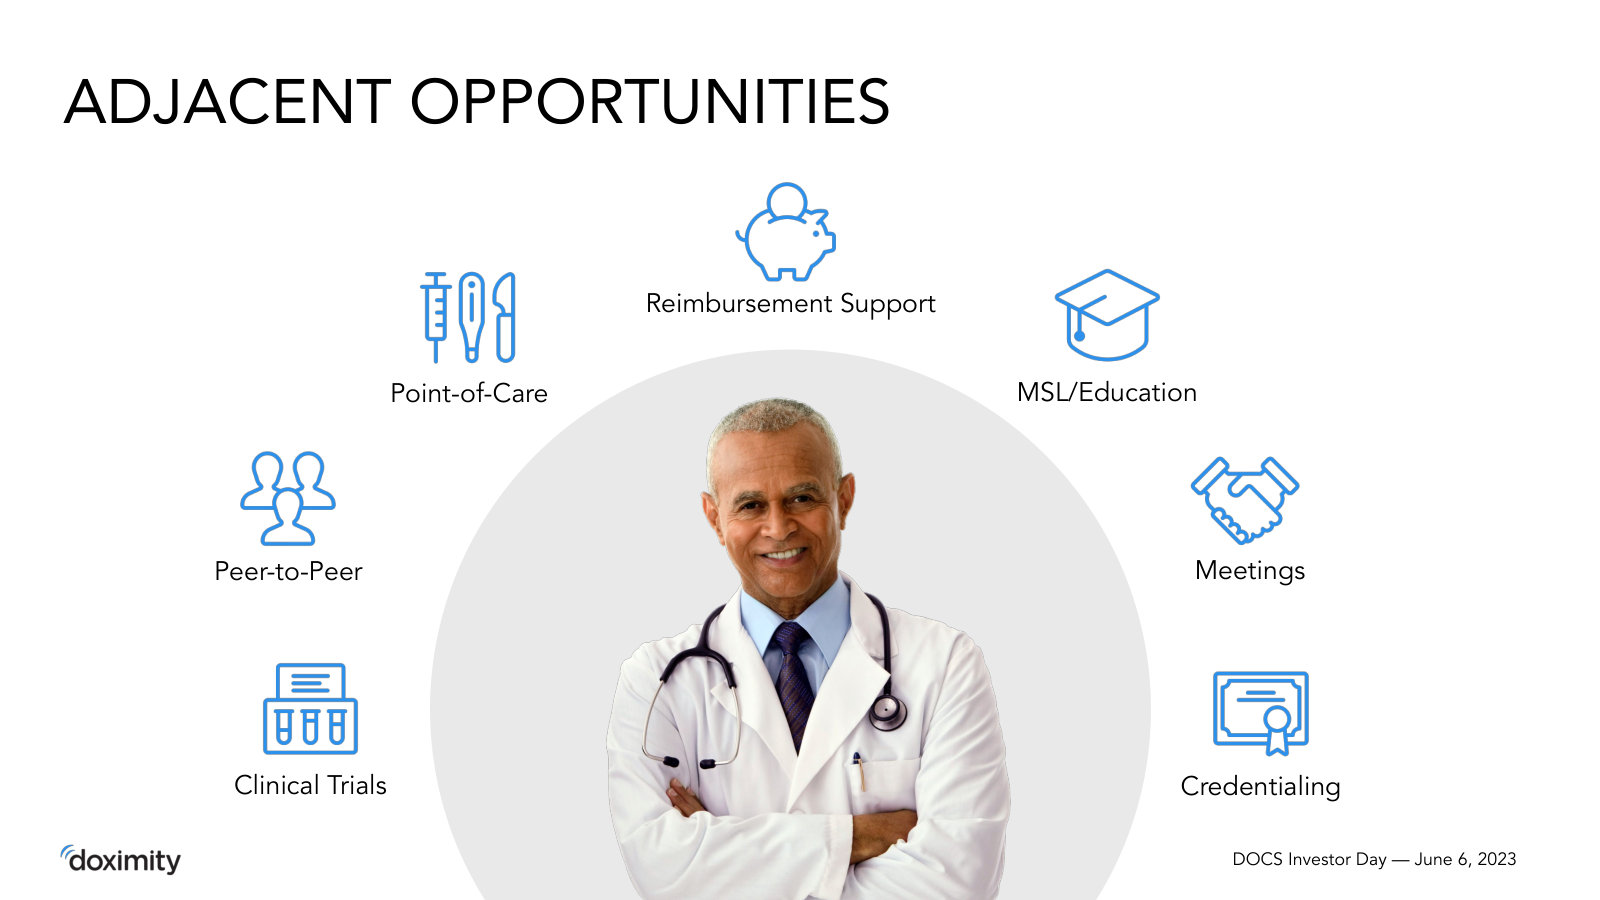
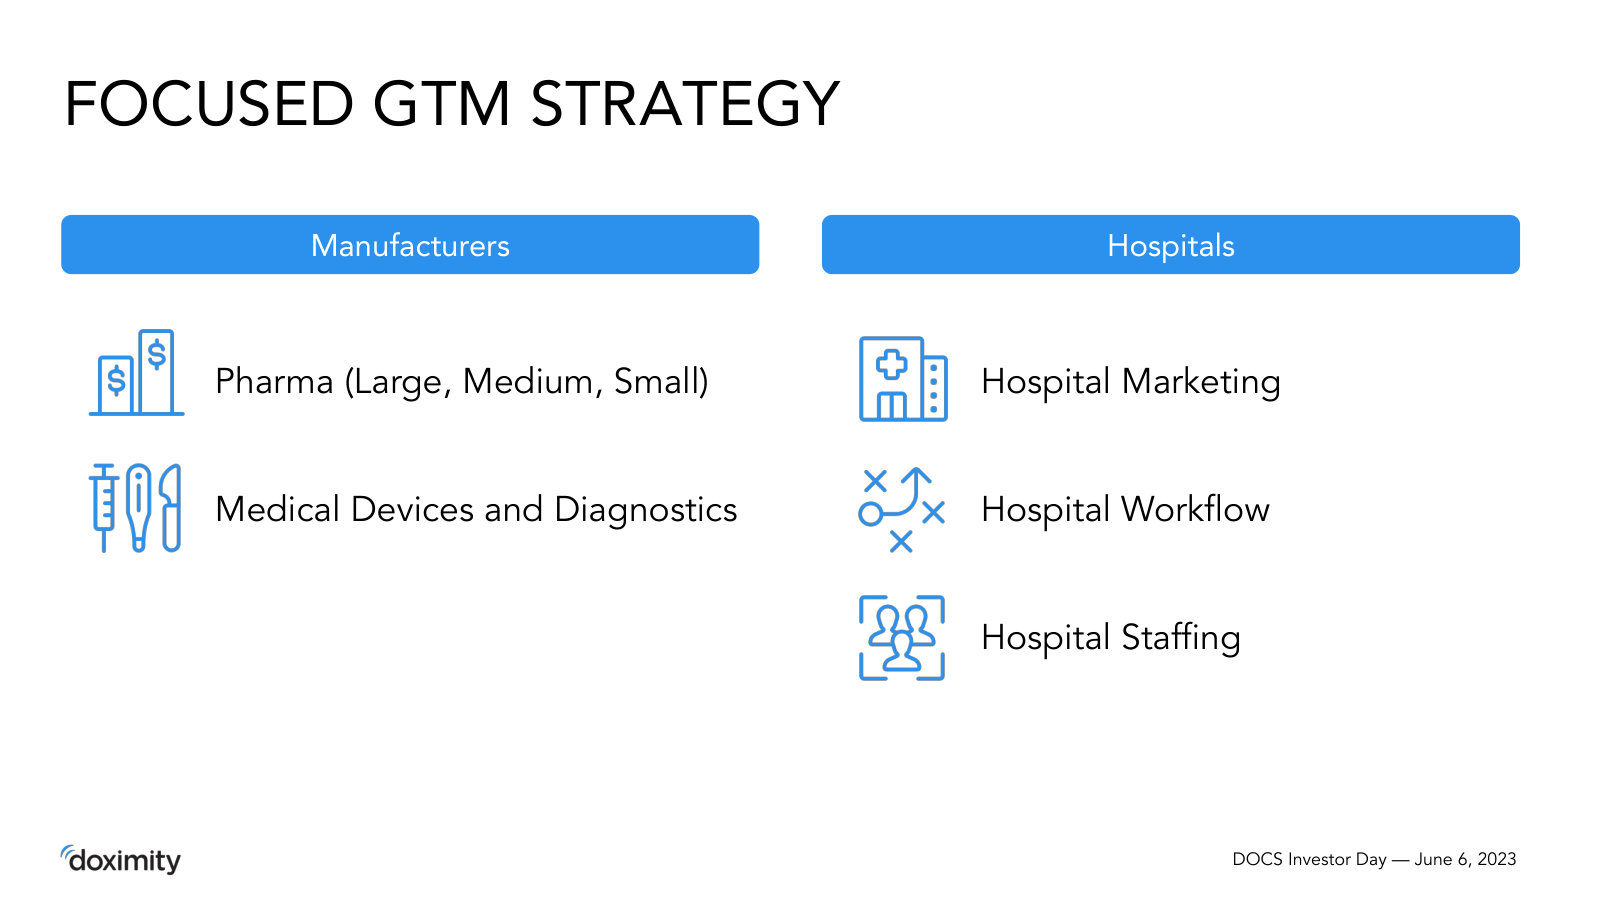
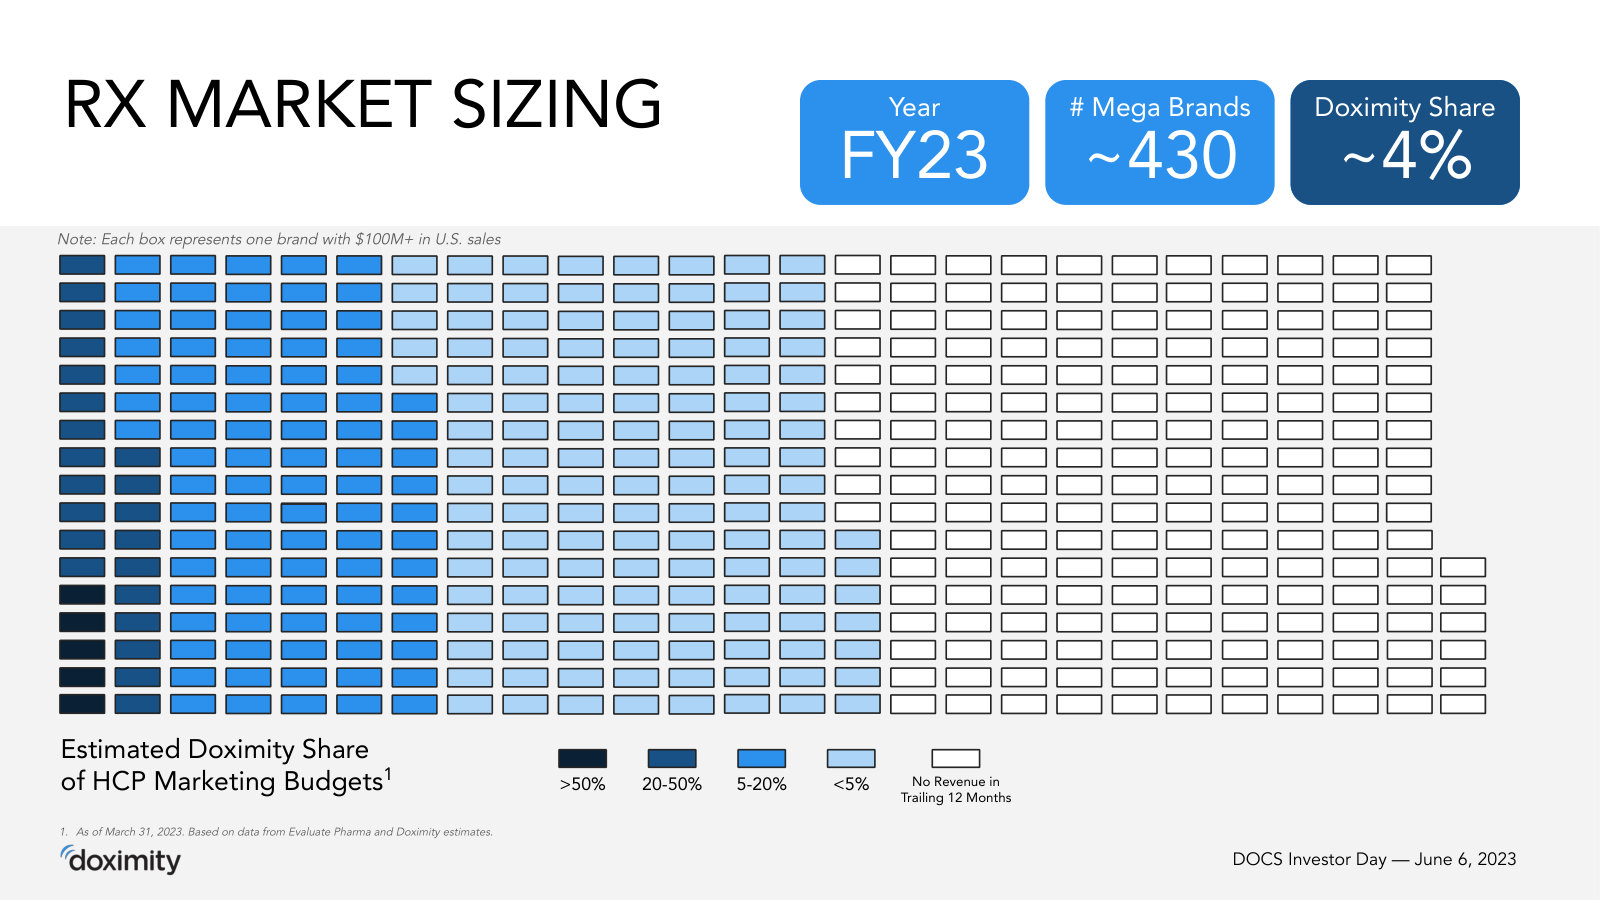
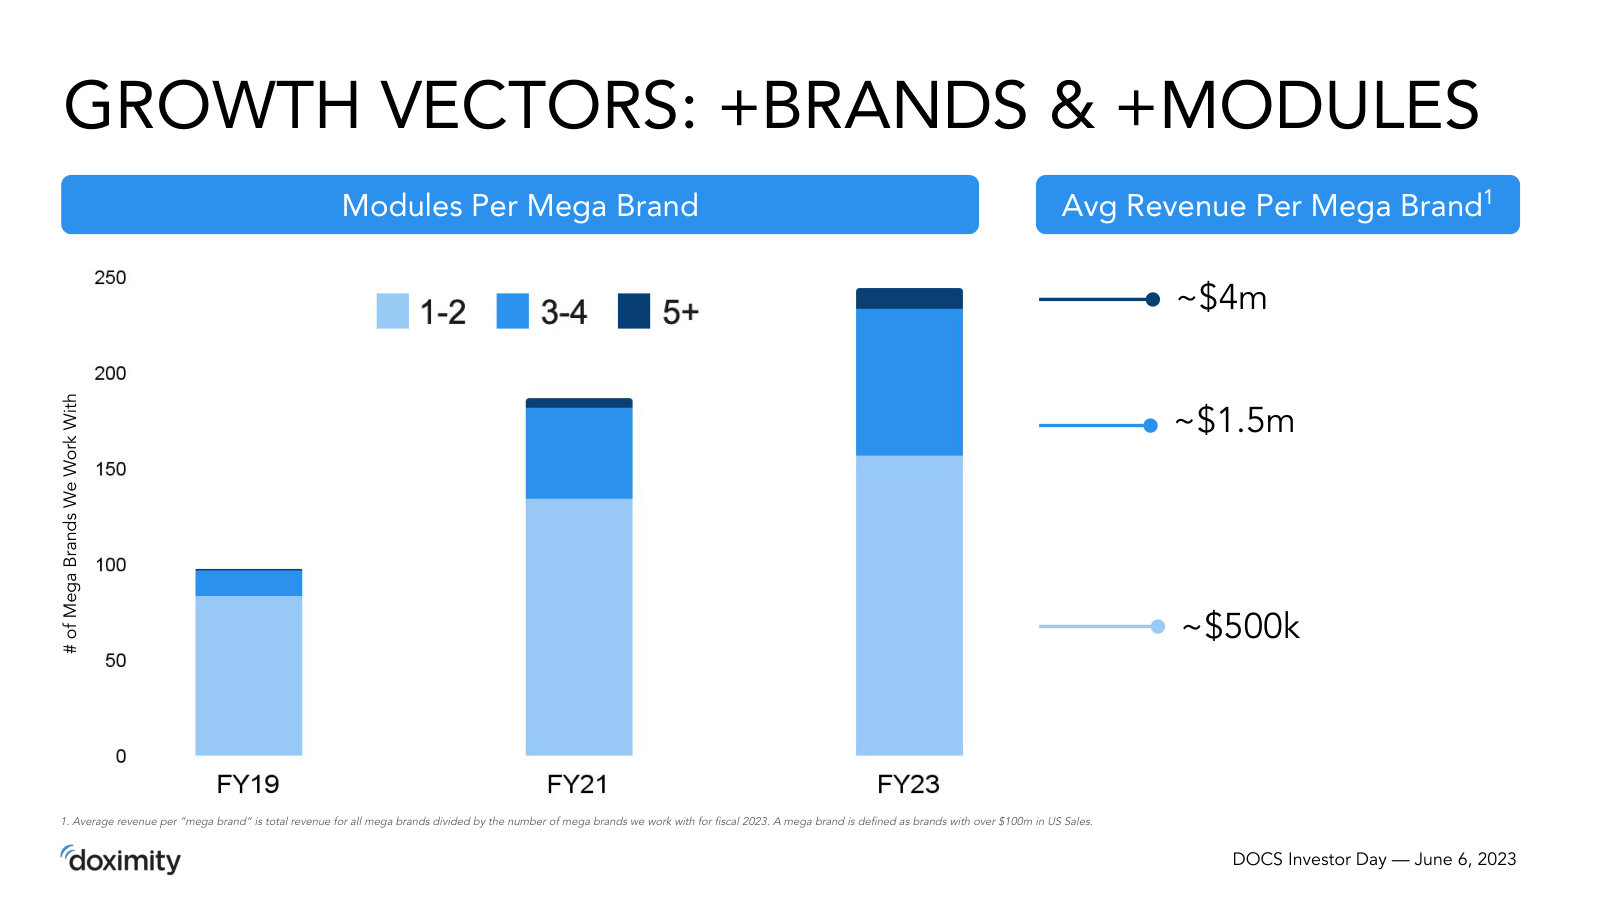
Doximity, Inc.'s management explains the business in its own materials. The slides below do the most of that work, pulled from the documents preserved in Sources. Each source link opens the complete presentation at that slide in a new tab.
Investor Presentation — Spring 2026 — Spring 2026
Management's current, self-contained explainer: what the platform is, how it makes money, the AI push, the market and the latest financials. · Open the full document →

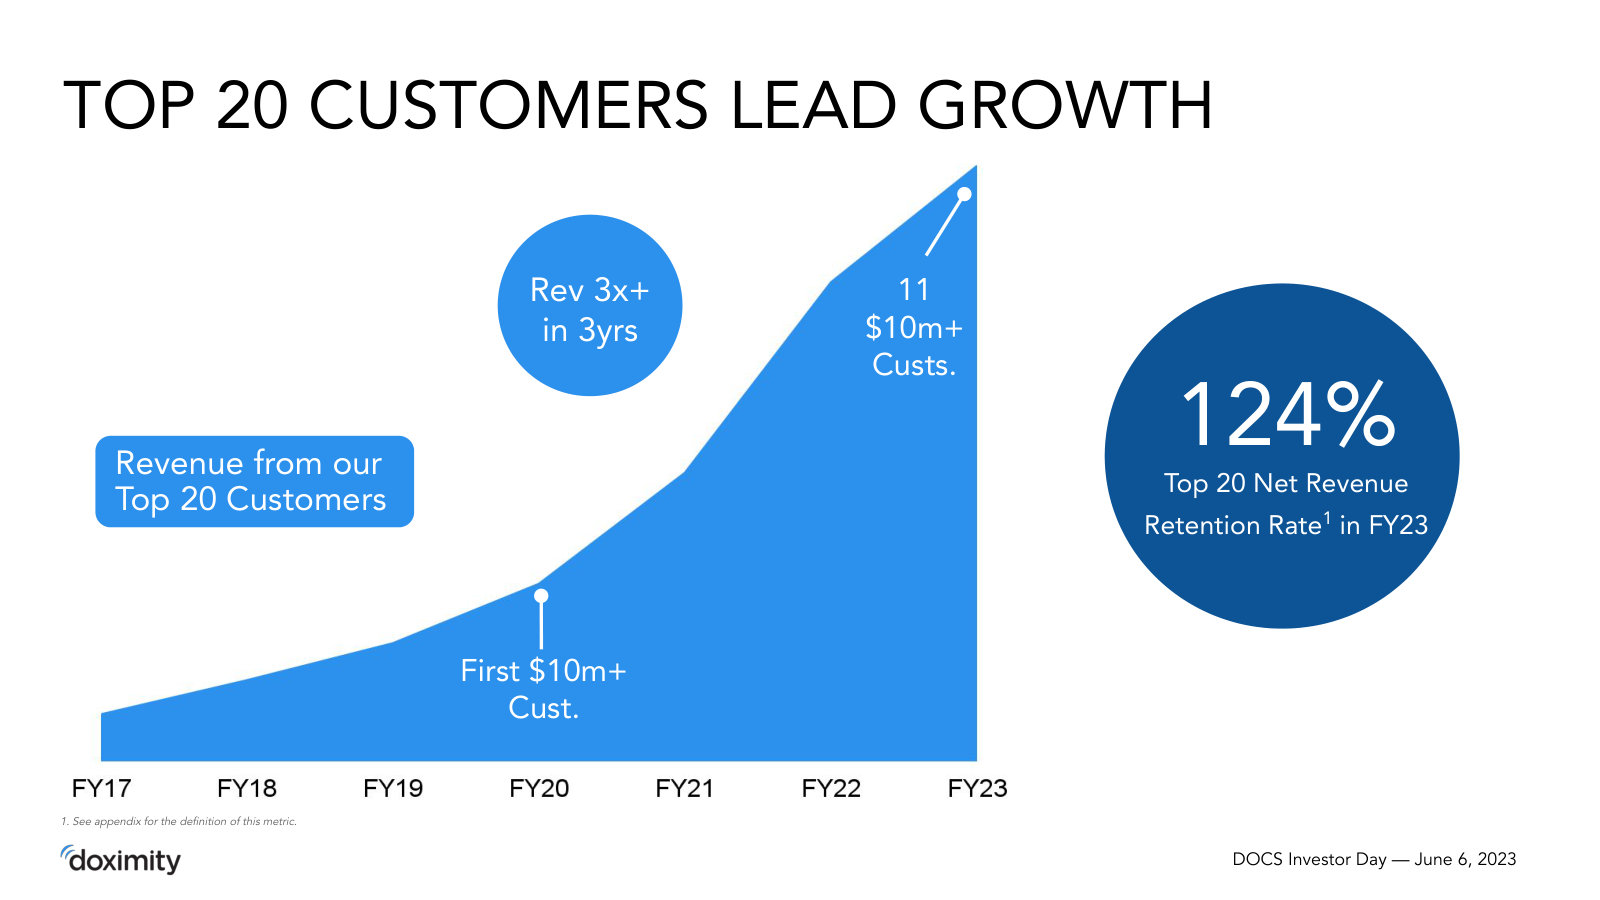
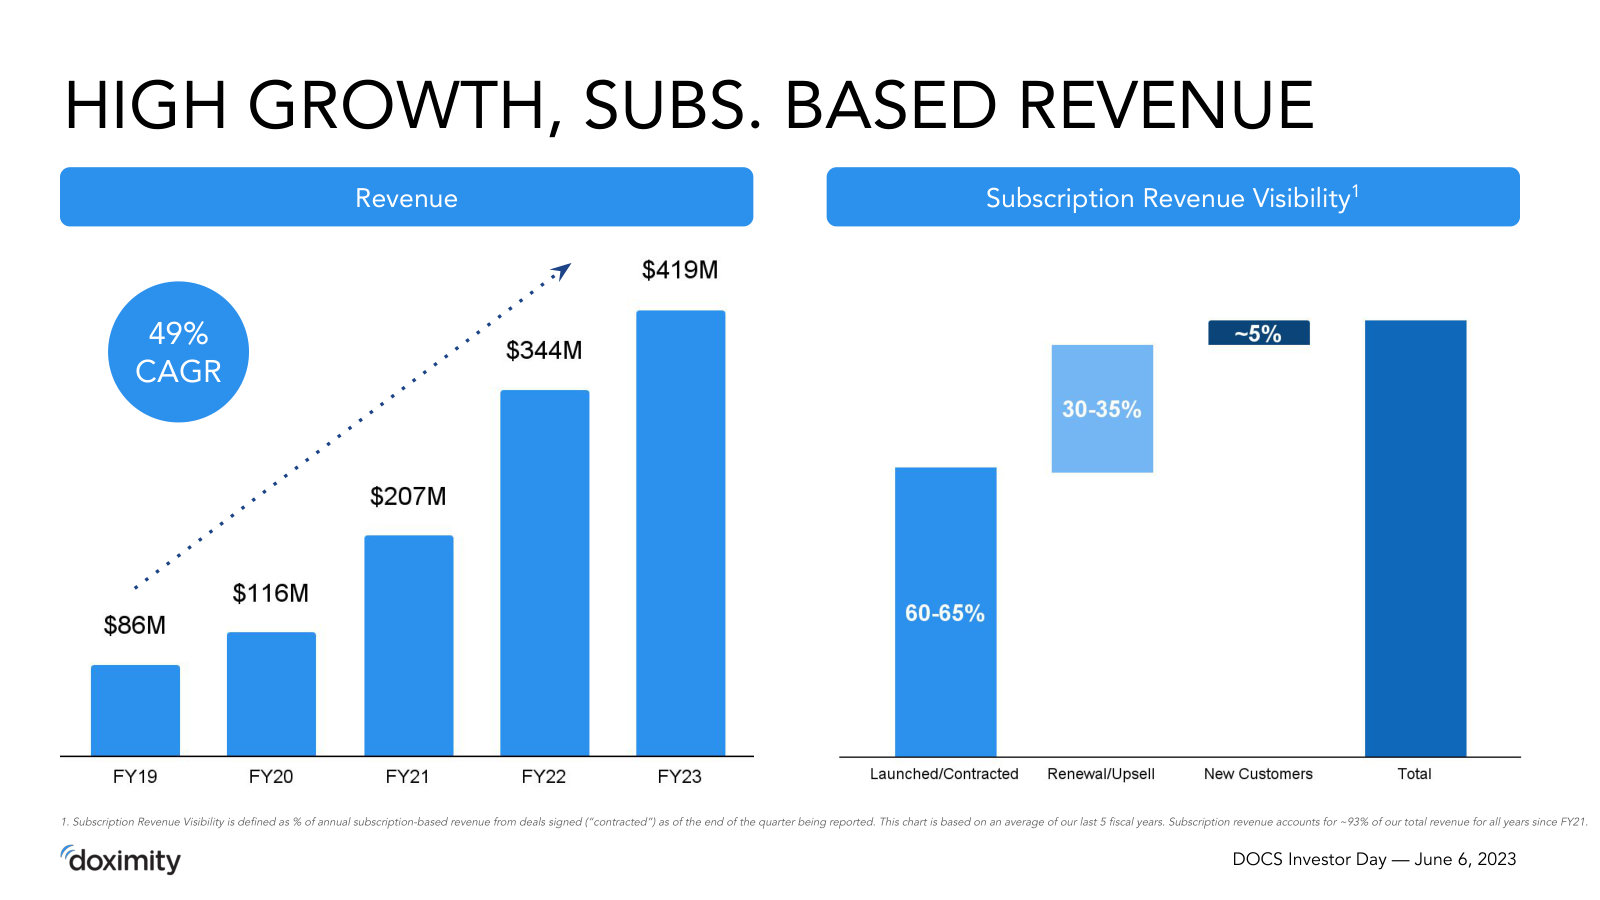
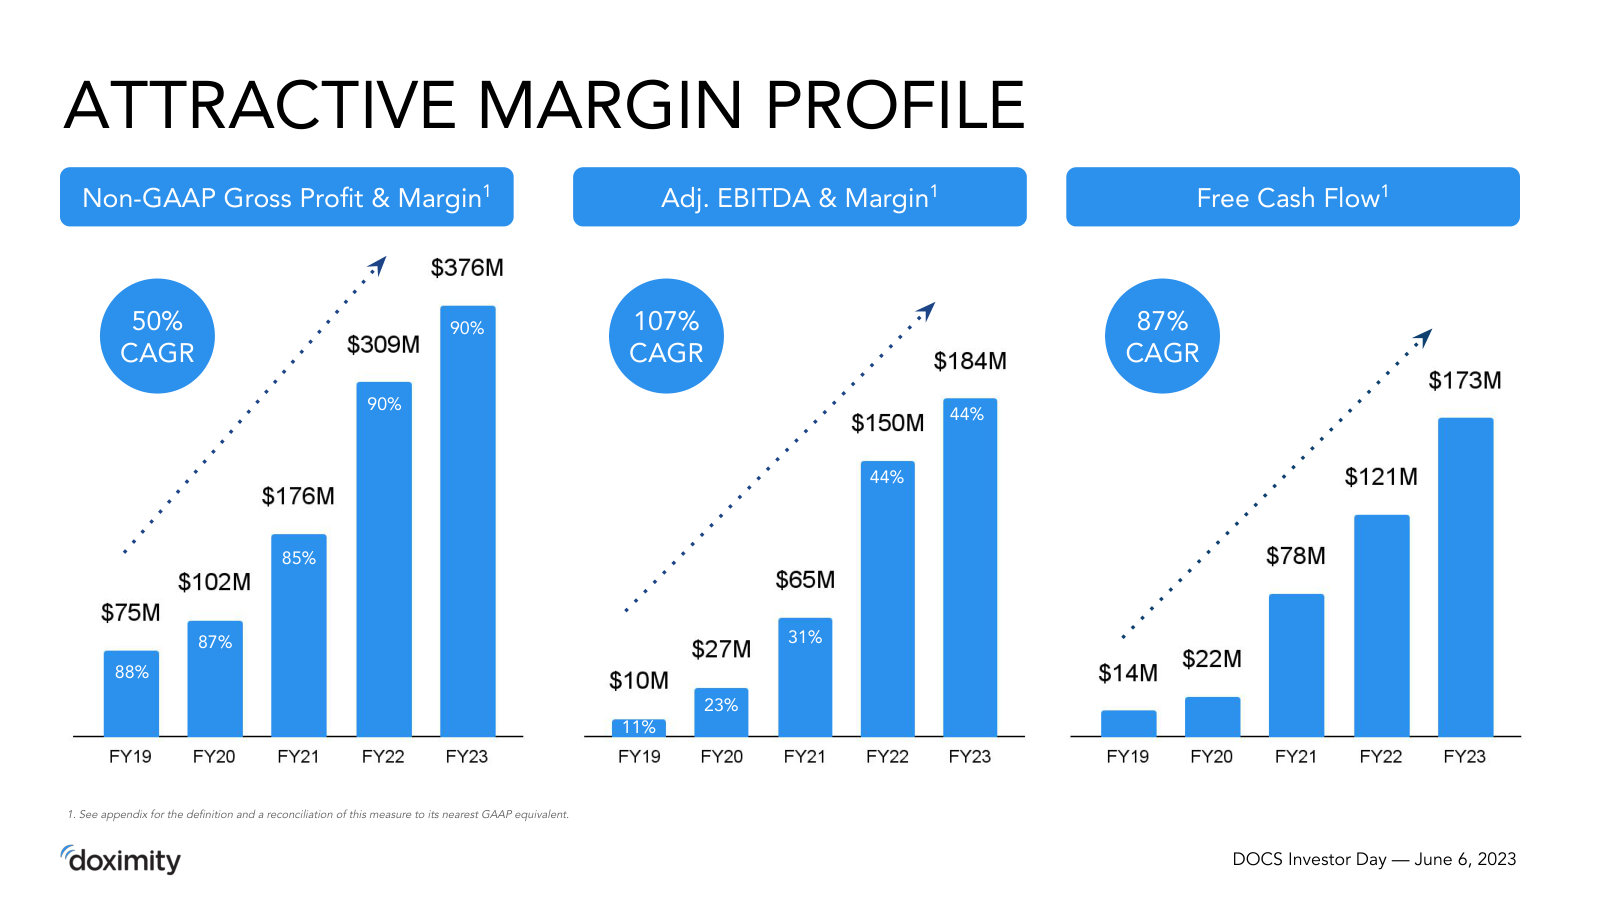
Investor Day 2023 — Investor Day 2023
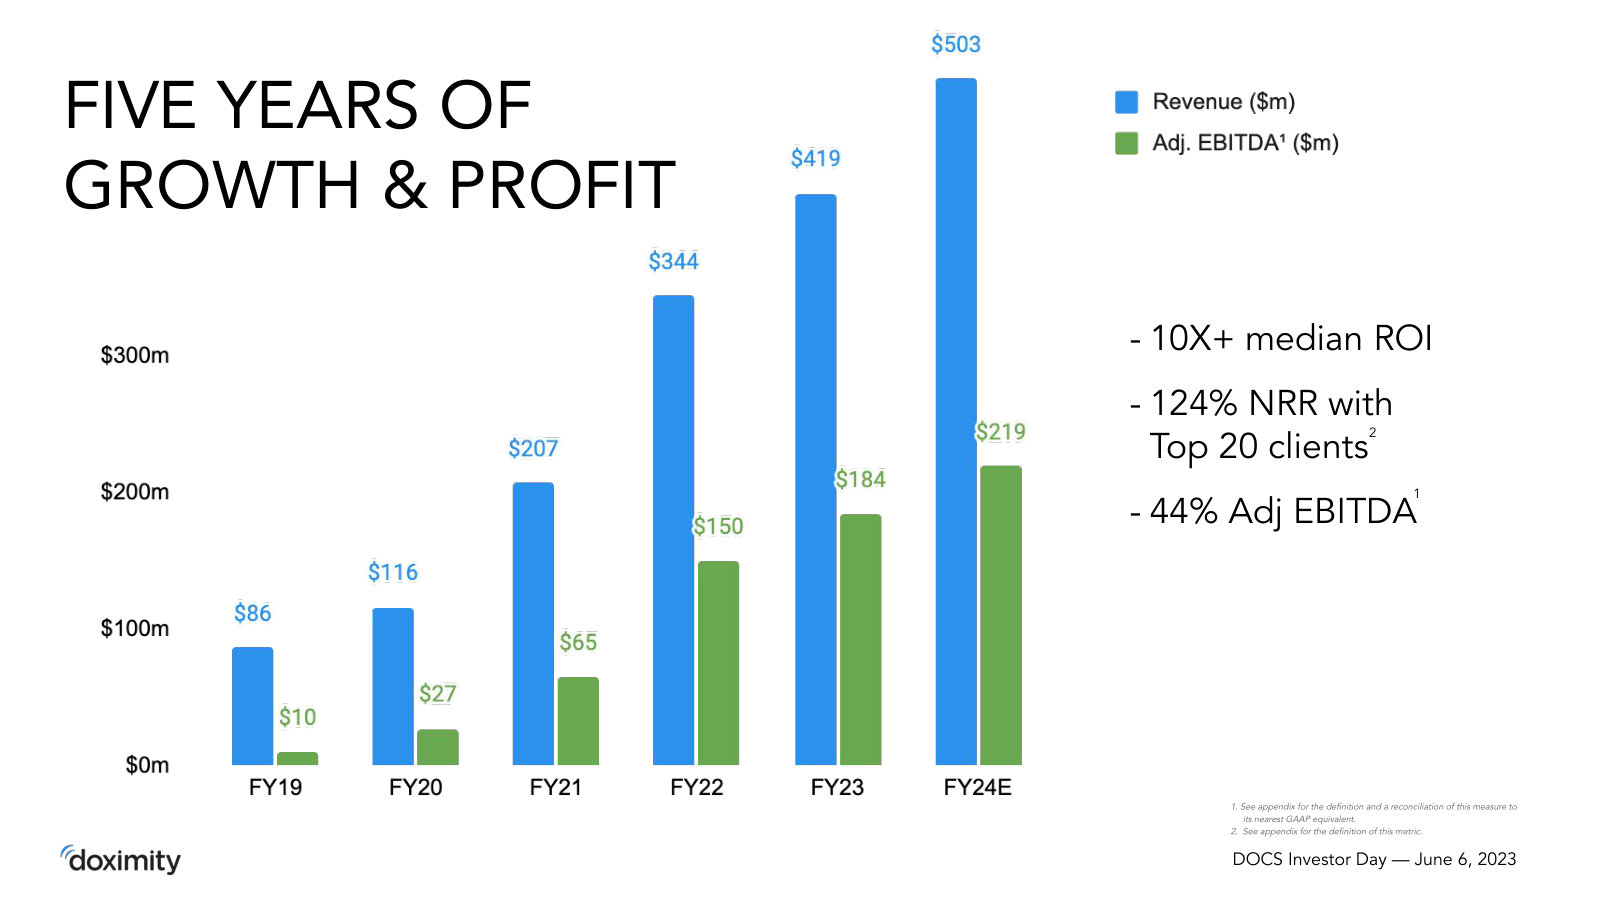
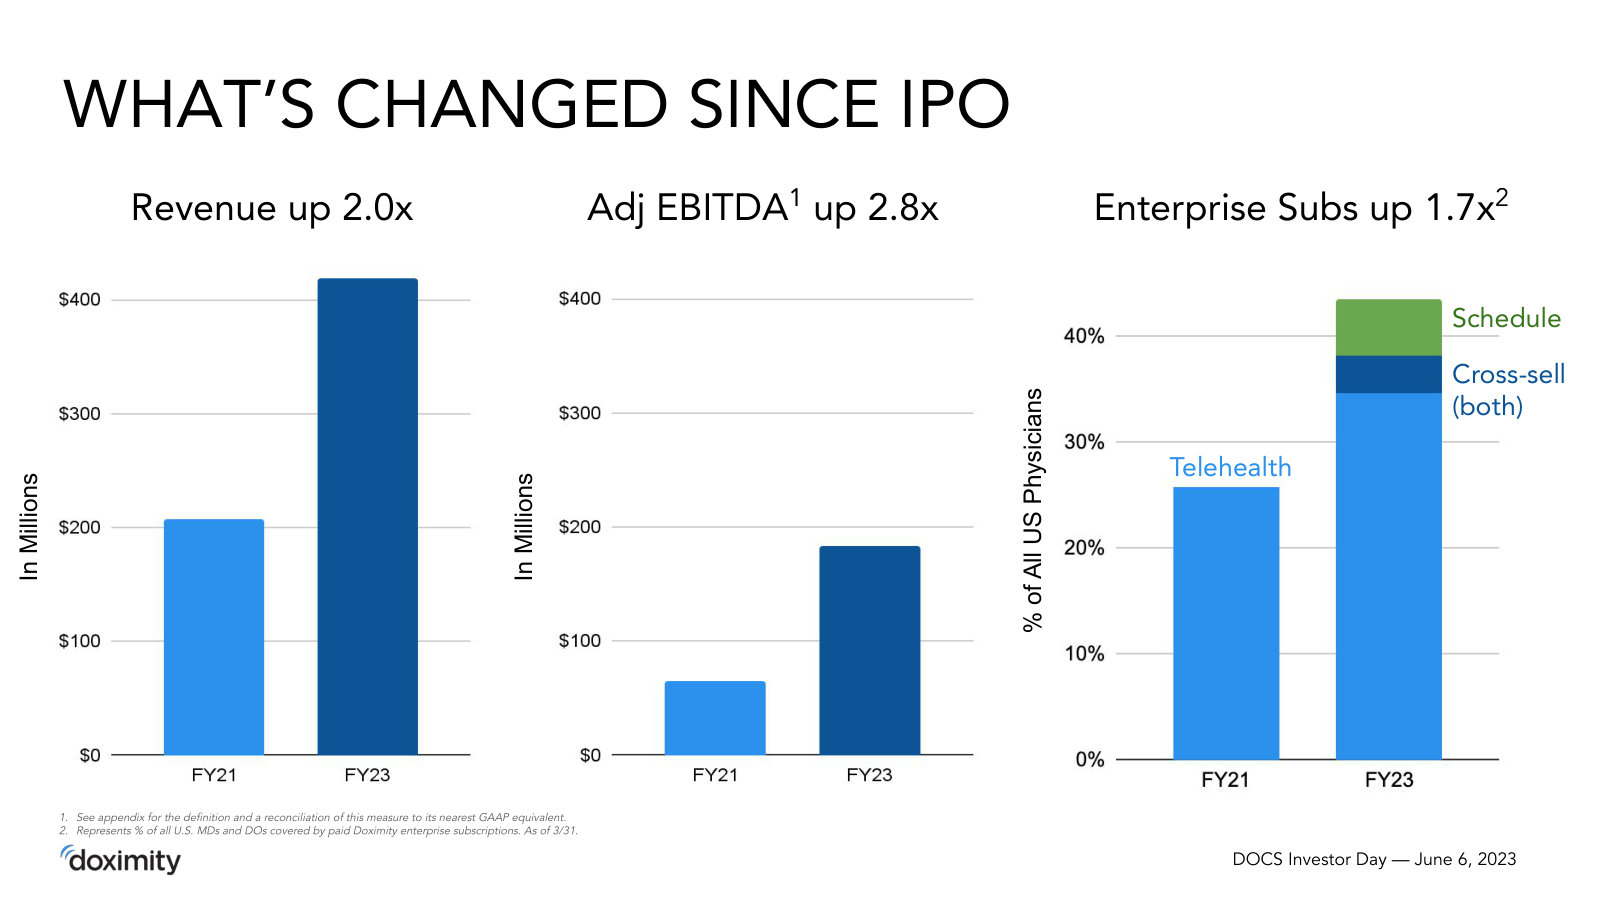
The fullest strategic deep-dive Doximity has published — market structure, the pharma-marketing thesis and multi-year unit economics the quarterly decks only summarize. Content is the June 2023 Investor Day. · Open the full document →
Doximity, Inc.'s management answers for the business every quarter. These are the exchanges that explain it best — verbatim, from the call transcripts preserved in Sources. Each link opens the full transcript at that page in a new tab.
Q4 FY2026 Earnings Call — Q4 FY2026
Management's clearest statement of the 'AI investment year': how it plans to monetize physician AI, why margins fall on purpose, and a new CFO and President. · Open the full transcript →
The headwind behind the 4% guide: soft HCP ad demand, shorter buys, and 65% of revenue already booked.
Perry Gold (VP, Investor Relations): We are witnessing a continuation of the trend discussed on our last call, with short-term demand in the HCP digital pharma ad market soft and visibility still limited. This market environment is the result of policy uncertainty remaining elevated and increased macro risk. Taken together, we expect overall market growth to be modest this year, likely at or below 5%. Consistent with broader industry trends, many brands still made meaningful upfront investments, but with more modest growth and shorter planning horizons than typical. As a result, we currently have 65% of our subscription-based revenue guidance booked at this point, in line with our three-year average, however, with more moderate growth incorporated into our guide than prior years.
p. 3 · Read in context →
The distribution moat: 140 health systems onto the clinical-AI suite in two quarters, HIPAA-compliant.
Jeff Tangney (Co-Founder & CEO); Craig Hettenbach (Morgan Stanley): It took us two full years with our telehealth product, Dialer. And this was during COVID, when things were moving very fast. It took us two full years to get to 140 hospital enterprise clients, and we've done that in two quarters with our AI product which is pretty impressive. And now we have over 250,000 doctors in the U.S., a lot more than anyone else, who have the full HIPAA-permission, HIPAAcompliance to put patient data into our tools to help them provide better care, ask questions, get answers. And I think that's a pretty sizable moat.
p. 9 · Read in context →
The pricing lever most miss: shorter contracts cost Doximity visibility but earn higher prices.
Jeff Tangney (Co-Founder & CEO); Ryan Halsted (RBC Capital Markets): So listen, if we go back five years, I think most of what we sold were annual programs that they would layer on more to in the midyear, right? That's how things work. We're in an environment right now where there's just a lot of change. The AI news cycle, everything, it's moving at a very rapid pace. So the bad news is that, that does hurt our visibility when clients prefer to sign three and six months sort of commitments. The good news is we do it at higher prices. And actually, we're quite explicit about that. So the year-long contracts I mean they get decent discounts for those upfront commitments and clients understand that if they make shorter commitments, they pay higher prices. So in the long run, it could work out to be better for us that we're getting better prices.
p. 11 · Read in context →
The bear case put to management — is pharma learning to spend less on HCP ads? — and the 'we're the more' reply.
David Roman (Goldman Sachs); Jeff Tangney (Co-Founder & CEO): At what point do you ask yourselves or how do you reassure investors that pharma companies aren't figuring out how to do more with less and the businesses are doing fine without deploying a lot of resources toward HCP advertising? So this is going to be constrained for a longer period of time until they figure out the next area in which to invest. […] So I think pharma companies will do more with less, but we're the more. Today, they spend a lot of the mechanics and analytics and data warehouses. […] And so this allows them to really put money where it works for them, which is where the ROI is.
p. 12 · Read in context →
Q1 FY2026 Earnings Call — Q1 FY2026
The AI pivot laid out end to end: the Pathway acquisition, the Scribe launch, and Jeff's 'third act' framing of how the AI suite fits the model. · Open the full transcript →
The Pathway acquisition: a six-person Montreal AI team whose model scored 96% on the U.S. medical licensing exam.
Jeffrey A. Tangney (CEO): Lastly, we are happy to announce the acquisition of Pathway, a Montreal-based startup of six people that specializes in AI clinical reference. The team includes physicians trained at McGill, Johns Hopkins, and Harvard. They had previously developed a comprehensive medical AI dataset, called their corpus, to assist with the daily questions faced in the ICU. The strength of this dataset lies in its cross-linked structure, allowing AI to provide reliable answers quickly. Pathway's AI model achieved a record 96% on the U.S. medical licensing exam this May, surpassing competitors.
p. 2 · Read in context →
Jeff frames AI as Doximity's 'third act' — after the newsfeed and workflow tools — answering doctors' clinical questions.
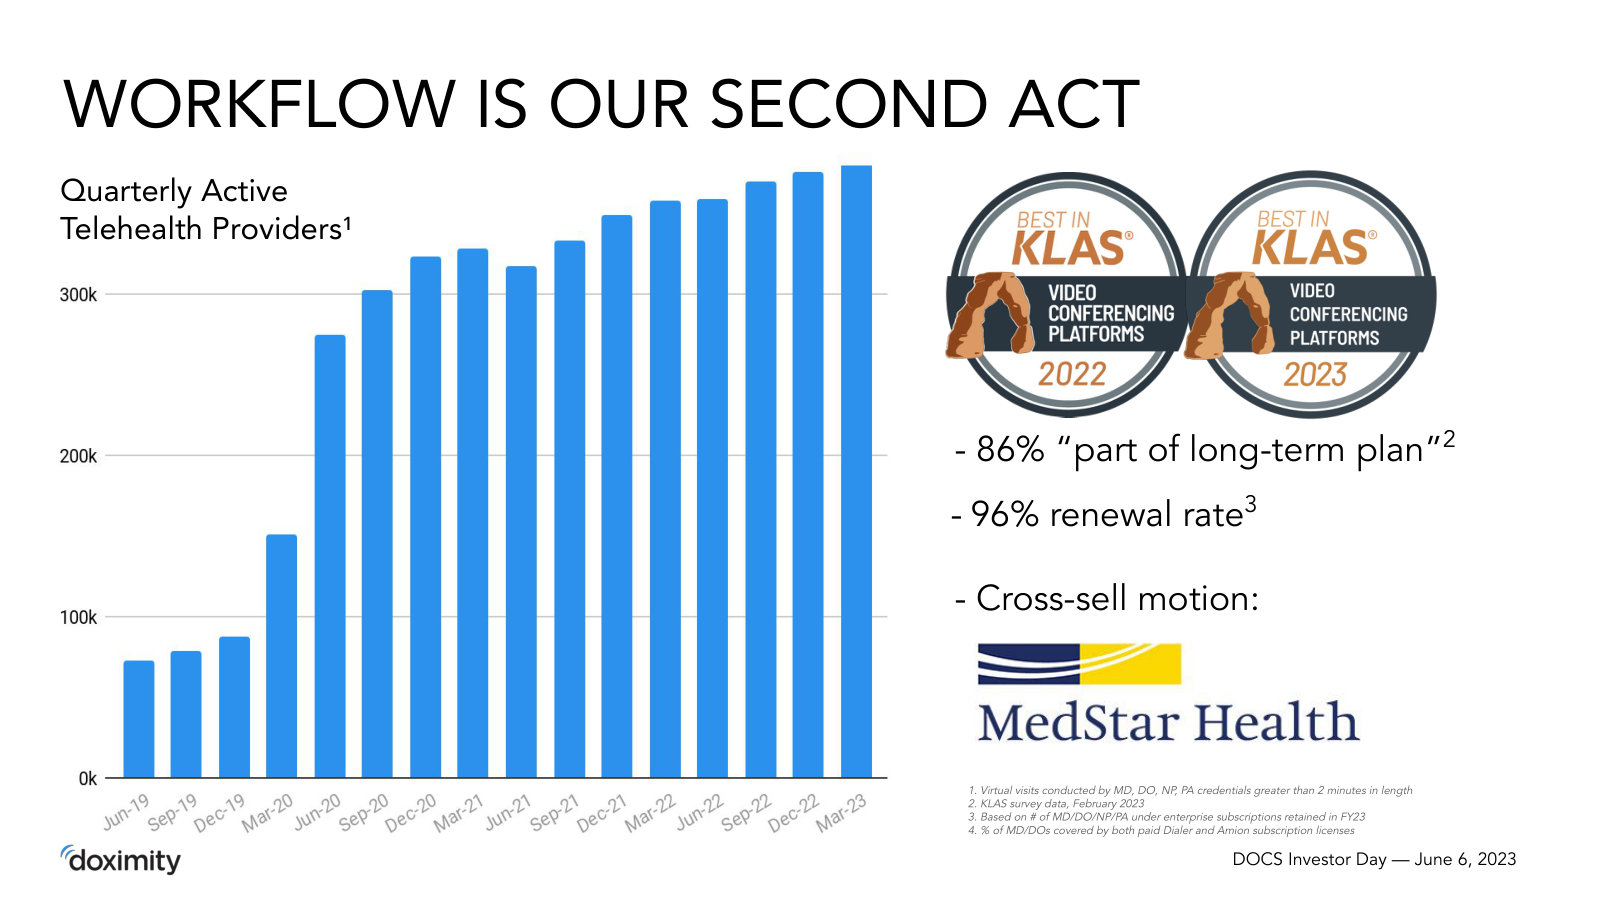
Jeffrey A. Tangney (CEO); Brian Christopher Peterson (Raymond James): we're certainly very proud of our first two acts here as a company. The first act being our newsfeed and our LinkedIn style feature set, which has a record high over 1 million prescribers last quarter. And then our second act being our workflow tools, scheduling, fax, telehealth, Doximity Dialer, which was 630,000 active prescribers last quarter. So I really think AI, these AI tools and AI suite could be our third act here. That third act is answering the questions that doctors have when they're in front of patients. […] The GPT helps doctors write, the Scribe takes notes, and the Pathway acquisition answers their clinical questions and guidelines and drug dosage questions. All of that, I think, will work together seamlessly and provide an opportunity that I think is, in many ways, as big or perhaps even bigger than our first two acts
p. 3 · Read in context →
Why engagement compounds across products: sticky scheduling, telehealth at ~45% of U.S. physicians, a decade-long newsfeed data moat.
Jeffrey A. Tangney (CEO); Elizabeth Hammell Anderson (Evercore ISI): In our workflow tools, our scheduler continues to grow, and scheduling is something doctors really have to check every day. They need to know what time their shift starts and which cardiologist is on call. It's a very sticky product, and we're just pleased to see that continue to notch up new client wins. […] Our Doximity dialer package has never seen so many clients or over 200 health systems now, roughly 45% of all U.S. physicians have a paid version of our Doximity Dialer telehealth platform. And that's also a very frequent use case. […] what it boils down to is 10 years of first-party data, knowing what doctors are interested in what types of clinical news and just knowing best how to sort through all of the new journal articles that are published every week, every day and help folks out with those.
p. 5 · Read in context →
The monetization path: give AI away free, then follow the Dialer playbook to a paid enterprise product.
Jeffrey A. Tangney (CEO); Ryan Scott Daniels (William Blair): We see this being similar to our dialer product, which started as a free offering and later evolved into an enterprise product, ultimately becoming a successful revenue stream. We recognize the opportunities here and have already had discussions with a few of our Dialer clients regarding Scribe. We are encouraged by the success of Pathway, which has managed to get thousands of doctors to pay $300 per year for their clinical products, presenting another long-term opportunity for direct subscription revenue. In summary, you can expect us to approach this in the same way we did with Dialer, which took a few years to transition from the initial free product to premium enterprise versions.
p. 6 · Read in context →
Unit economics of free AI: transcription now costs 'pennies per visit,' so Scribe can stay free without denting margins.
Jeffrey A. Tangney (CEO); Stanislav Berenshteyn (Wells Fargo Securities): one of the limiting factors, I think we had a year or two ago with Scribe was the cost of medical-grade transcription and medicalgrade, HIPAA-grade LLM use. Thankfully, for us, those costs have come down dramatically. […] There's been a lot of competition in the market, and our expectation is they'll continue to come down. So we're in the pennies per visit camp on this now, which is similar to where we're at with our Dialer product. We don't see the cost there being a barrier given our business model.
p. 12 · Read in context →
Q3 FY2024 Earnings Call — Q3 FY2024
A beat-and-raise that still guided the next quarter down sharply — the call where the Street pressed Doximity's guidance philosophy and management explained the portal and new modules. · Open the full transcript →
How the upfront works: the December quarter locks in next year's budgets; new modules tap dollars outside marketing.
Anna Bryson (CFO): As a reminder, our December quarter represents our largest sales quarter by a significant amount. This is when our pharma customers sign on for next year's programs, committing the majority of their annual marketing budgets. While we've signed these contracts in Q3, we will primarily recognize revenue over the next 12 months, depending on the timing of program launches. During this upfront season, we saw strong growth with our brand partners, particularly among the number of brands spending at least $1 million with us. This cohort grew to 75 brands this selling season, an increase of roughly 30% year-over-year. Of these $1 million plus brands, we had three brands that spent at least $10 million each, an increase from the one $10 million plus brand we had last year. We also saw strength in our modules that often sit outside of traditional marketing budgets, such as Peer-to-Peer, Pointof-Care, and Formulary. These modules combined grew by more than 100% year-over-year during our upfront season.
p. 2 · Read in context →
Where AI fits the model: automating the 2-hours-of-admin-per-patient-hour burden, a new engagement wave 'like COVID did with telehealth.'
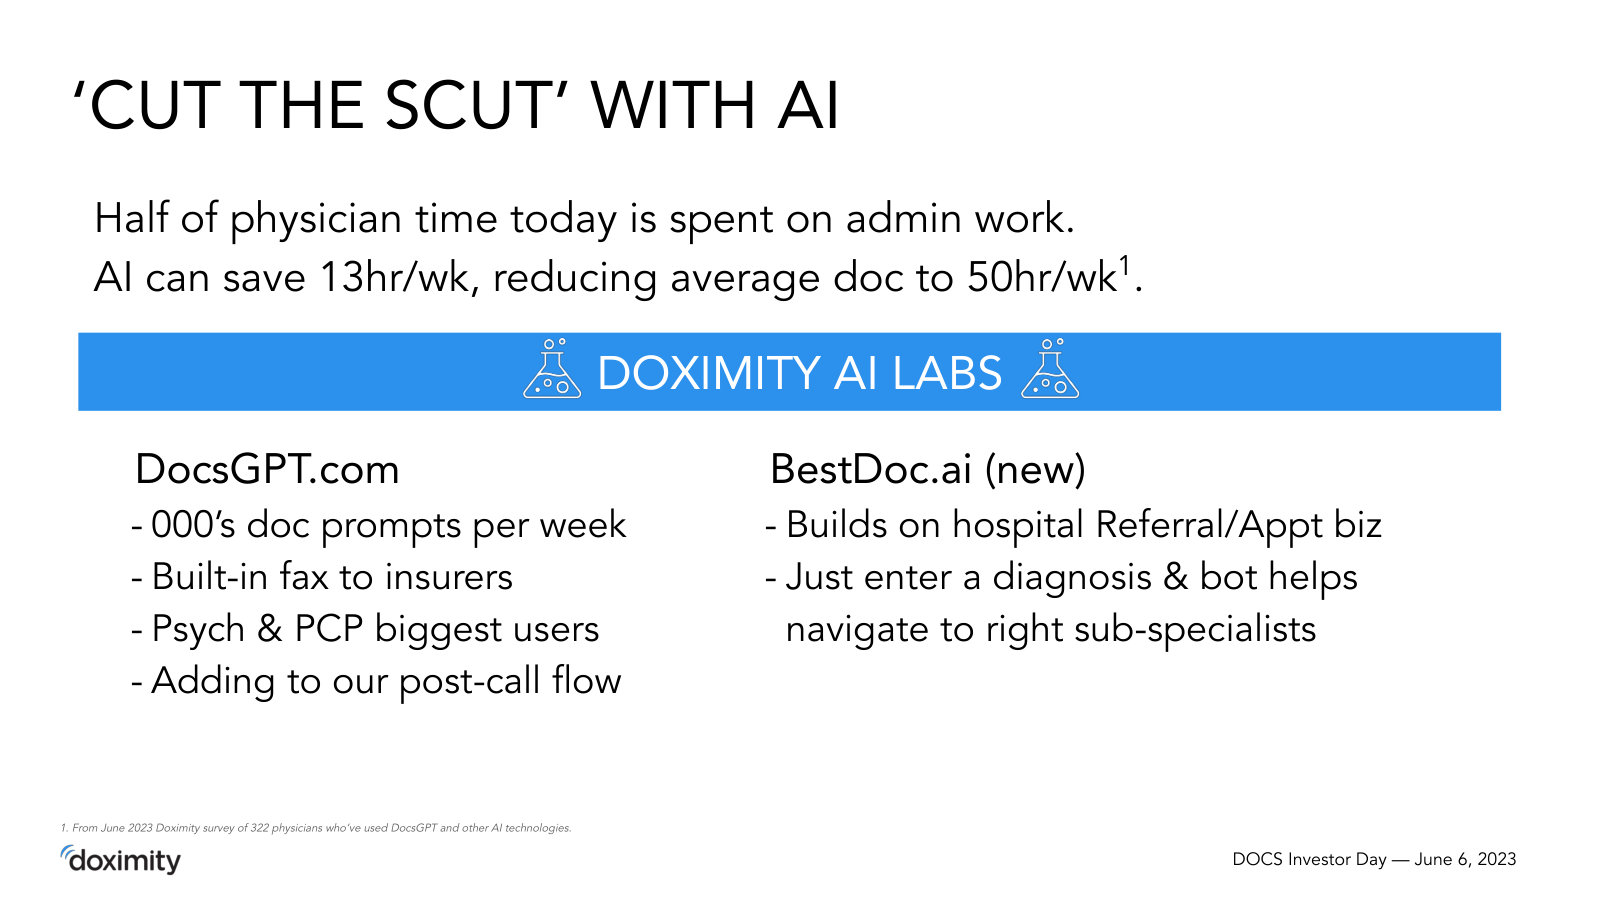
Jeff Tangney (CEO and Co-Founder); Ryan Daniels (William Blair): the average doctor spends two hours doing administrative work for every one hour they spend seeing patients, which is an incredible problem in this country. And we're helping them take that two hours and really shrink it down. There's a lot of mediocre writing that has to be done in healthcare, and what AI is really good at is mediocre writing. It's really good at helping you get the administrative work done to fight with the insurance companies or others more quickly. So we're super excited that, that will drive a whole another wave of engagement for us, just like COVID did with our telehealth that will, again, accrue to our clients in terms of increased newsfeed and workflow platform usage.
p. 5 · Read in context →
The pointed question — is the soft Q4 guide 'finding religion' on conservatism? — and Jeff's engagement-first answer.
Stephanie Davis (Analyst); Jeff Tangney (CEO and Co-Founder): how do you bridge the implied step down in the 4Q growth guidance? Is there anything unique beyond timing to cal out there? Or is it reflective of finding religion on a more conservative guidance philosophy? […] you're right in a sense that I'm an engagement first then monetization sort of person. And that's been our approach as well with a product that is really all about monetization, which is helping our clients purchase from us. We're the best product in the market. When our clients sat down at the end of the year to sit down and do their annual reviews of all the programs and all the partners that they work with, again, they're telling us that we win in terms of ROI. We win in terms of our service. We, I think, clearly outgrew the rest of the market here this last quarter, but we're not the easiest to buy from. So we're the best product but not the easiest to buy. And really, we want to fix that.
p. 6 · Read in context →
The ROI proof and data moat: physician-level prescription data and licensed formulary sets that pharma can't easily replicate.
Jeff Tangney (CEO and Co-Founder); David Larson (Analyst): we do have access to prescription-level data at the physician level from industry-leading companies. This is a significant advantage for our clients, as they typically would have to wait months for a custom project to compile that data to optimize their marketing efforts and assess their performance. […] We've licensed the two leading data sets, so we know which plans are associated with which doctors and which brands are linked to those plans. This allows us to inform individual physicians that their patients may not have a high co-pay for certain medications. This is beneficial for our clients, doctors, and patients needing that medication.
p. 11 · Read in context →
Q4 FY2022 Earnings Call — Q4 FY2022
The first full-year call as a public company — the clearest look at the recurring-revenue 'Go Get' model, the mega-brand opportunity, and pharma's shift to digital. · Open the full transcript →
The 'Go Get' model: ~60% of guidance already under contract, ~35% renewals and upsells, only 5% from brand-new clients.
Jeff Tangney (Co-Founder and CEO): Today, we're raising our fiscal 2023 annual guidance by $6 million to a midpoint of $456 million, or 33% growth year on year. As with past years, 60% of our subscription-based annual guidance was already under contract as of March 31, and we expect another 35% to come from renewals and upsells with existing clients. So only 5% of our annual guidance is what we call Go Get, that is revenue from new clients.
p. 4 · Read in context →
The land-and-expand engine at IPO scale: 157% net revenue retention and a fast-growing base of seven-figure accounts.
Anna Bryson (CFO): Full year revenue grew to $343.5 million, a substantial 66% increase year over year. Similar to prior quarters, our existing customers continued to lead our growth. We finished the year with a net revenue retention rate of 157%. We are very encouraged by the increasing scale at which our customers are spending on our platform, demonstrating the tremendous value they are receiving from our solutions. We ended the year with 265 customers contributing at least $100,000 each in subscription-based revenue. This is a 33% increase from the 200 customers we had in this cohort a year ago. Out of these 265 customers, 45 contributed at least $1 million in revenue for the year. This represents a 55% increase from the 29 seven-figure plus customers we had a year ago.
p. 7 · Read in context →
On concentration risk: no single customer is more than 10% of revenue; the base is top pharma manufacturers.
Anna Bryson (CFO); Stephanie Davis (SVB Leerink): You'll see in our 10-K when it comes out next week, that we have no customer that represents more than 10% of our revenue. And to your question, kind of going a layer deeper, our largest customers are top pharma manufacturers.
p. 11 · Read in context →
The secular thesis by analogy: a digital-first drug launch (Biohaven's NURTEC) beating big-sales-force incumbents.
Jeff Tangney (Co-Founder and CEO): I'll tell you that Claritin sort of revolutionized direct-to-consumer advertising for pharma back in 1995, right? Those blue-sky TV ads they ran, it was the first time it had ever been done, and that industry went from zero to $10 billion in less than a decade. And we think Biohaven with a digital-first launch against industry heavyweights, really did, I think, create this new poster child for digital first, and we're really proud to have worked deeply with Vlad and his team as we did. And we think that the industry pays attention to these things, and so we're going to see more folks start to follow that NURTEC model.
p. 16 · Read in context →
Where the growth is coming from: mid-tier 'digital David' challengers, all-in on digital, spending fast per brand.
Jeff Tangney (Co-Founder and CEO); Brian Peterson (Raymond James): So our market share among the mid-tier has actually been lower because we've really focused all of our outbound sales effort on those top 20 pharma. So as I said in our prepared remarks, the top 20 pharma have 13 mega brands each in their portfolios on average, and most mid-tiers are just one or two. So there's less land and expand growth for us, but actually, what we've seen this past year, is that these mid-tiers, since they're all in on digital, it's their chance to be the digital David up against the top-tier Goliath, right?
p. 17 · Read in context →
The long runway: pharma still only ~20–30% digital vs. ~70% at the Fortune 500 — the core secular bet.
Jeff Tangney (Co-Founder and CEO); Matt Shea (Needham and Company): our best estimate is that pharma still is only spending 20% to 30% of its marketing dollars digitally. The mid-tier is probably higher for the reasons I just said. They're starting more from scratch and they're going where the ROI is. And so they may be over 50% digital, which is closer to the Fortune 500, which is at 70% digital, right? So that's the opportunity, I think, for us in mid-tier to, I think, lead the rest of the market.
p. 19 · Read in context →
More calls
Q3 FY2026 Earnings Call — Q3 FY2026 · 11 pages · The onset of the soft HCP ad market and the first read on how the AI-monetization plan was taking shape ahead of launch. · Open →
Q2 FY2026 Earnings Call — Q2 FY2026 · 14 pages · Progress on the AI suite (Scribe, Pathway, PeerCheck) and how fast AI engagement was ramping against workflow usage. · Open →
Q4 FY2025 Earnings Call — Q4 FY2025 · 13 pages · Full fiscal 2025 wrap-up and the framing that set up the coming 'AI investment year,' plus the FY2026 guide. · Open →
Q3 FY2025 Earnings Call — Q3 FY2025 · 14 pages · The upfront selling season with the client portal now driving purchasing, and management's read on pharma budgets. · Open →
Q4 FY2024 Earnings Call — Q4 FY2024 · 8 pages · Full fiscal 2024 results and the first buying season with portal purchasing opening up to clients. · Open →
Q1 FY2024 Earnings Call — Q1 FY2024 · 10 pages · Early framing of the modules strategy and the first mentions of a HIPAA-compliant DocsGPT in the newsfeed/workflow suite. · Open →
Q3 FY2022 Earnings Call — Q3 FY2022 · 4 pages · An early post-IPO call for the original pandemic-era growth rates and telehealth adoption baseline. · Open →
Q1 FY2022 Earnings Call — Q1 FY2022 · 4 pages · The very first earnings call after the June 2021 IPO — the original description of the network and business model. · Open →
Doximity, Inc.'s annual reports contain management's most considered account of the business. These are the sections, passages and visual pages worth opening in the originals preserved in Sources.
Doximity, Inc. — FY2026 Annual Report (Form 10-K) — FY2026
The latest 10-K: management's fullest account of the physician-network-into-pharma-marketing model as it repositions around a Clinical AI Suite. · Open the full document →
Item 1. Business — Overview — p. 8 · Read the full section →
Defines what the company is and how the two-sided model turns a free physician network into paid pharma and health-system solutions.
Mission, physician-first design, and the Marketing/Hiring/Workflow revenue engine.
Our mission is to help every physician be more productive and provide better care for their patients. We are physician-first, putting technology to work for doctors instead of the other way around. That guiding principle has enabled Doximity to become an essential and trusted professional platform for physicians and their colleagues. We provide our members with AI-powered tools specifically built for medicine, enabling them to collaborate with colleagues, stay up to date with the latest medical news and research, manage their careers and on-call schedules, and conduct virtual patient visits. Our Clinical AI Suite supports the full day-to-day workflow of a physician, from patient communication to documentation to answering clinical questions. […] Our business model is designed to both respect and support our members while driving value for our customers through our Marketing, Hiring, and Workflow Solutions (as defined below). Our revenue-generating customers, primarily pharmaceutical manufacturers and health systems, have access to a suite of commercial solutions that benefit from broad usage by physicians and other medical professionals.
p. 8 · Read in context →
The network-effect flywheel management says is hard for competitors to replicate.
The ecosystem we have created in the medical community benefits from powerful network effects. Medical professional engagement with our platform increases as the breadth and utility of our tools expand, attracting even more members and driving broader and more effective communication and collaboration among healthcare professionals. This also drives greater value for our pharmaceutical and health system customers seeking to interact with specific groups of physicians and other medical professionals.
p. 8 · Read in context →
Our Solutions for Healthcare Customers — Marketing Solutions — p. 14 · Read the full section →
Shows who pays and how: brand-by-brand pharma and service-line health-system subscriptions, sold land-and-expand.
How Marketing Solutions are packaged and billed, and the land-and-expand motion.
We provide a digital marketing platform for pharmaceutical manufacturers and health systems on a subscription basis to serve our members with tailored sponsored content that is highly relevant to their clinical practices, including information about medications, clinical trials, guidelines and resources, and trends in medicine and patient care. Pharmaceutical manufacturers purchase programs on a brand-by-brand basis, and health systems execute programs on a service line-by-service line basis. […] We have become a valued collaborator to our customers, with a track record of expanding throughout the medication portfolios of pharmaceutical customers and into additional service lines throughout a health system, while also upselling additional modules.
p. 14 · Read in context →
Clinical AI Suite for Hospitals and Health Systems — p. 17 · Read the full section →
The newest strategic thrust: Ask, Scribe and Dialer bundled into an enterprise AI workflow adopted by 140+ health systems.
Enterprise adoption claim for the Clinical AI Suite.
More than 140 leading U.S. health systems have reviewed, approved through privacy and AI governance committees, and adopted the Clinical AI Suite, underscoring the enterprise-grade trust and compliance it delivers.
p. 17 · Read in context →
Item 1A. Risk Factors — p. 30 · Read the full section →
The two company-specific risks that could genuinely bite: revenue concentration and clinical-AI error liability.
Customer concentration — a single customer crossed 10% of revenue in FY2026, a new disclosure.
While one customer accounted for 10% or more of total revenue for the fiscal year ended March 31, 2026 and no customer met this threshold for the fiscal years ended March 31, 2025 and 2024, our revenue is relatively concentrated within a small number of key customers.
p. 36 · Read in context →
AI in a clinical setting: hallucinations and erroneous outputs carry outsized liability.
AI-enabled tools and features may produce outputs, recommendations, summaries, classifications, drafts, documentation, clinical reference responses, analyses, workflow-related content, or other materials that are inaccurate, incomplete, biased, offensive, misleading, or otherwise deficient. AI systems may also produce “hallucinations,” reflect errors or bias in training, input, or customer data, or behave unpredictably in response to incomplete, ambiguous, or adversarial prompts. Because our members and customers operate in the healthcare industry, errors or perceived errors in AI-enabled outputs may be particularly sensitive and could result in reduced trust in our offerings, member or customer dissatisfaction, reputational harm, contractual disputes, regulatory scrutiny, litigation, or other liability.
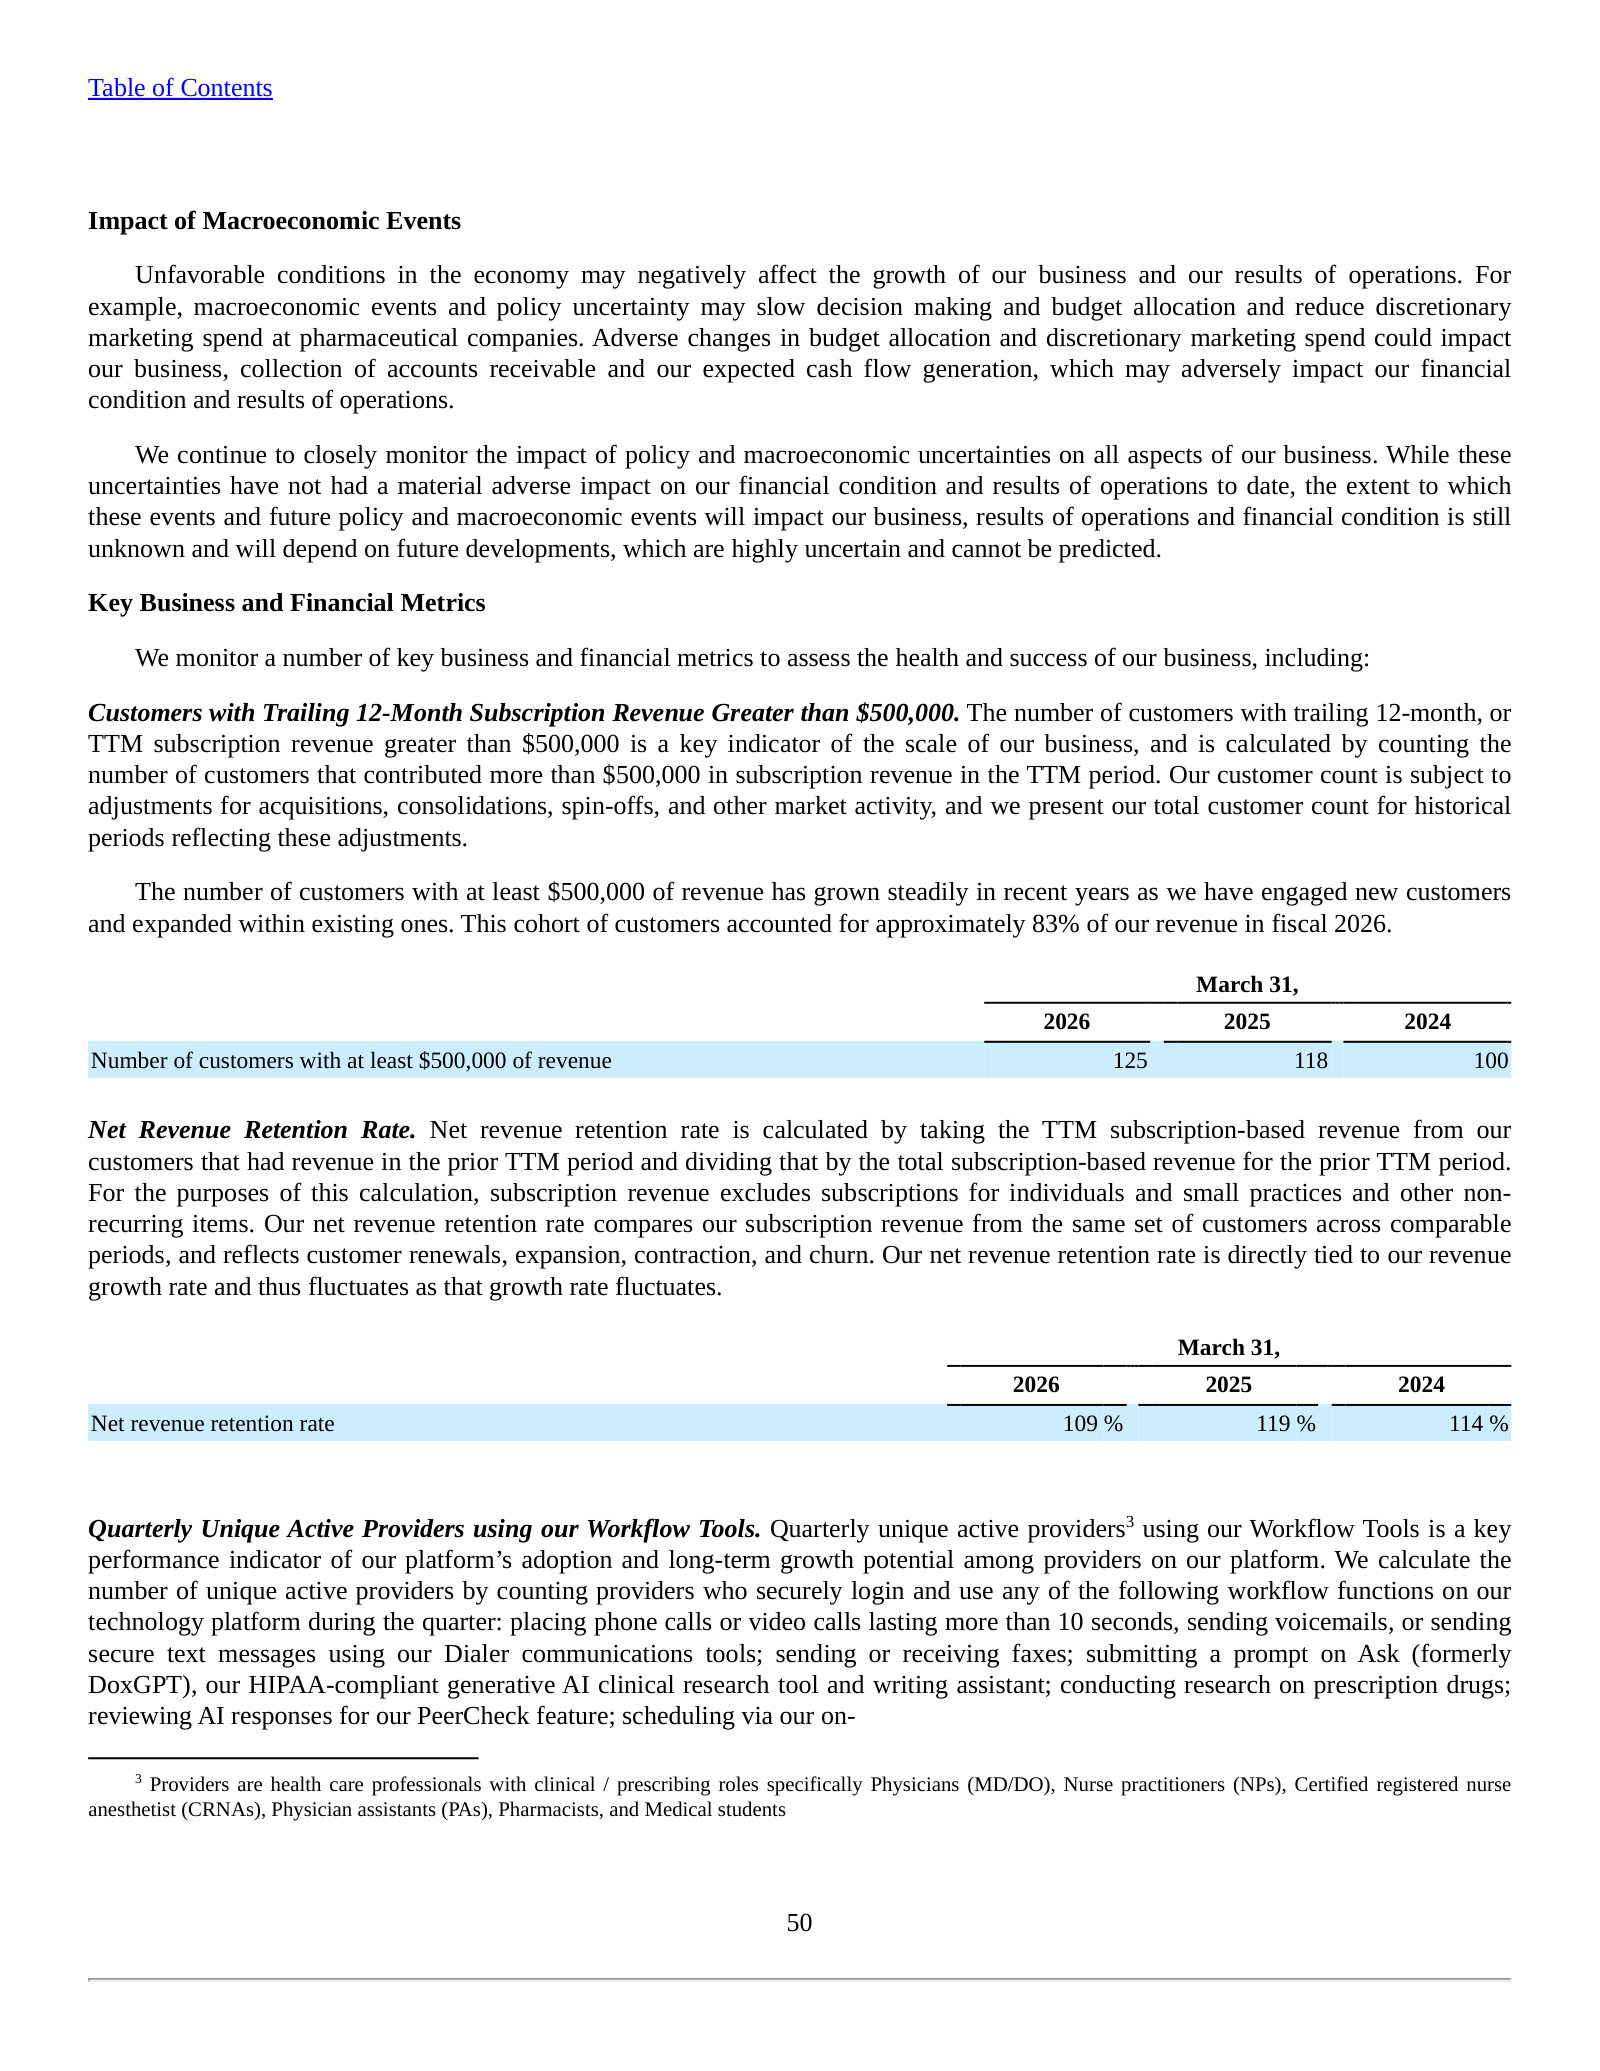
p. 50 · Read in context →
Item 7. MD&A — Overview and Key Metrics — p. 92 · Read the full section →
Management's own read on results: revenue and EBITDA at scale, but growth decelerating and net income down year over year.
Three-year revenue, net income and adjusted EBITDA — growth cooling from 20% to 13%.
Our business model has delivered high revenue growth at scale with profitability. For the fiscal years ended March 31, 2026, 2025 and 2024, we recognized revenue of $644.9 million, $570.4 million, and $475.4 million, respectively, representing year-over-year growth rates of 13% and 20%, respectively. Our net income was $196.1 million, $223.2 million, and $147.6 million for the fiscal years ended March 31, 2026, 2025, and 2024, respectively. For the fiscal years ended March 31, 2026, 2025 and 2024, we generated adjusted EBITDA of $357.8 million, $313.8 million, and $230.5 million, respectively.
p. 92 · Read in context →
Item 7. MD&A — Results of Operations — p. 97 · Read the full section →
Where the numbers move: the P&L table exposes the stock-based-compensation surge that drove net income lower despite higher revenue.
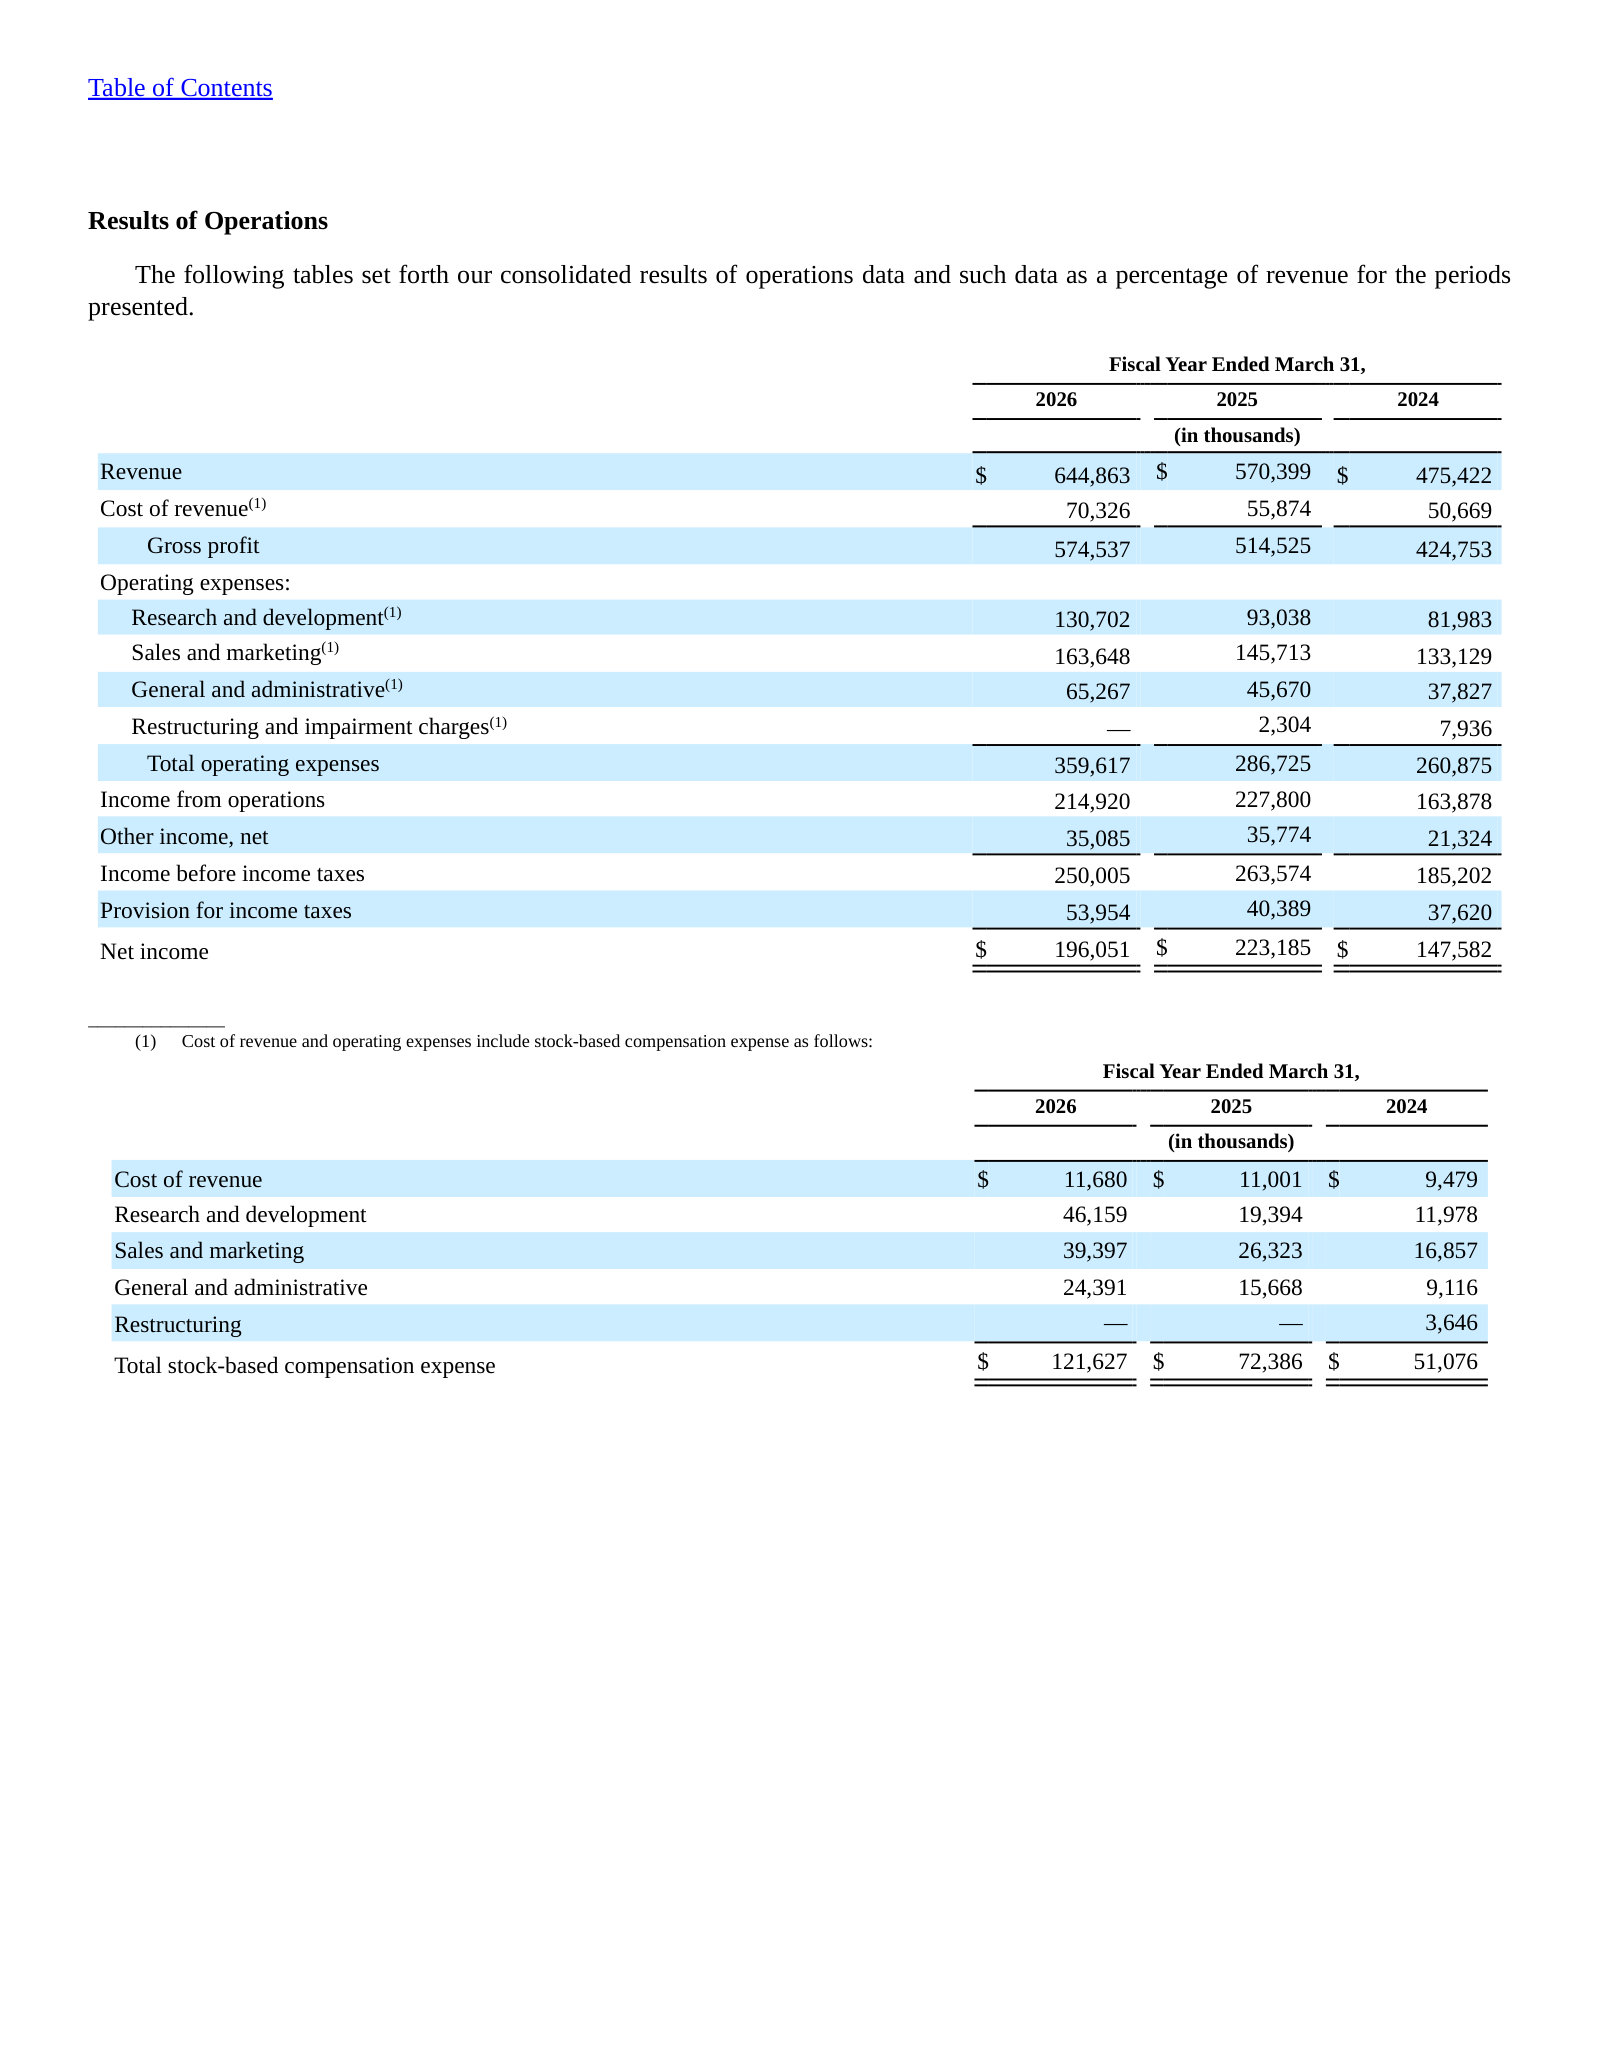
Revenue bridge — expansion of existing customers, not new logos, drove most of the gain.
Revenue for the fiscal year ended March 31, 2026 increased $74.5 million as compared to the fiscal year ended 2025. The increase was primarily driven by a $64.6 million increase in subscription revenue. Of the increase in subscription revenue, $16.2 million was driven by the addition of new subscription customers and $48.4 million was due to the expansion of existing customers.
p. 99 · Read in context →
Critical Accounting Policies and Estimates — Revenue Recognition — p. 108 · Read the full section →
The subscription-recognition policy defines the model and is the auditor's designated critical audit matter.
Stand-ready vs. distinct-module subscriptions and how each is recognized over time.
Marketing Solutions customers may purchase integrated and other subscriptions for a fixed fee that are not tied to a single module per month but allow customers to utilize a given module or combination of modules during the subscription period subject to limits on the total number of modules launched in a given period of time, active at any given time, and members targeted. These represent standready obligations in that the delivery of the underlying sponsored content is within the control of the customer and the extent of use in any given period does not diminish the remaining services.
p. 108 · Read in context →
Doximity, Inc. — FY2022 Annual Report (Form 10-K) — FY2022
The first 10-K after the June 2021 IPO — a pre-AI baseline that shows how far the positioning has since shifted. · Open the full document →
Item 1. Business — Overview — p. 8 · Read the full section →
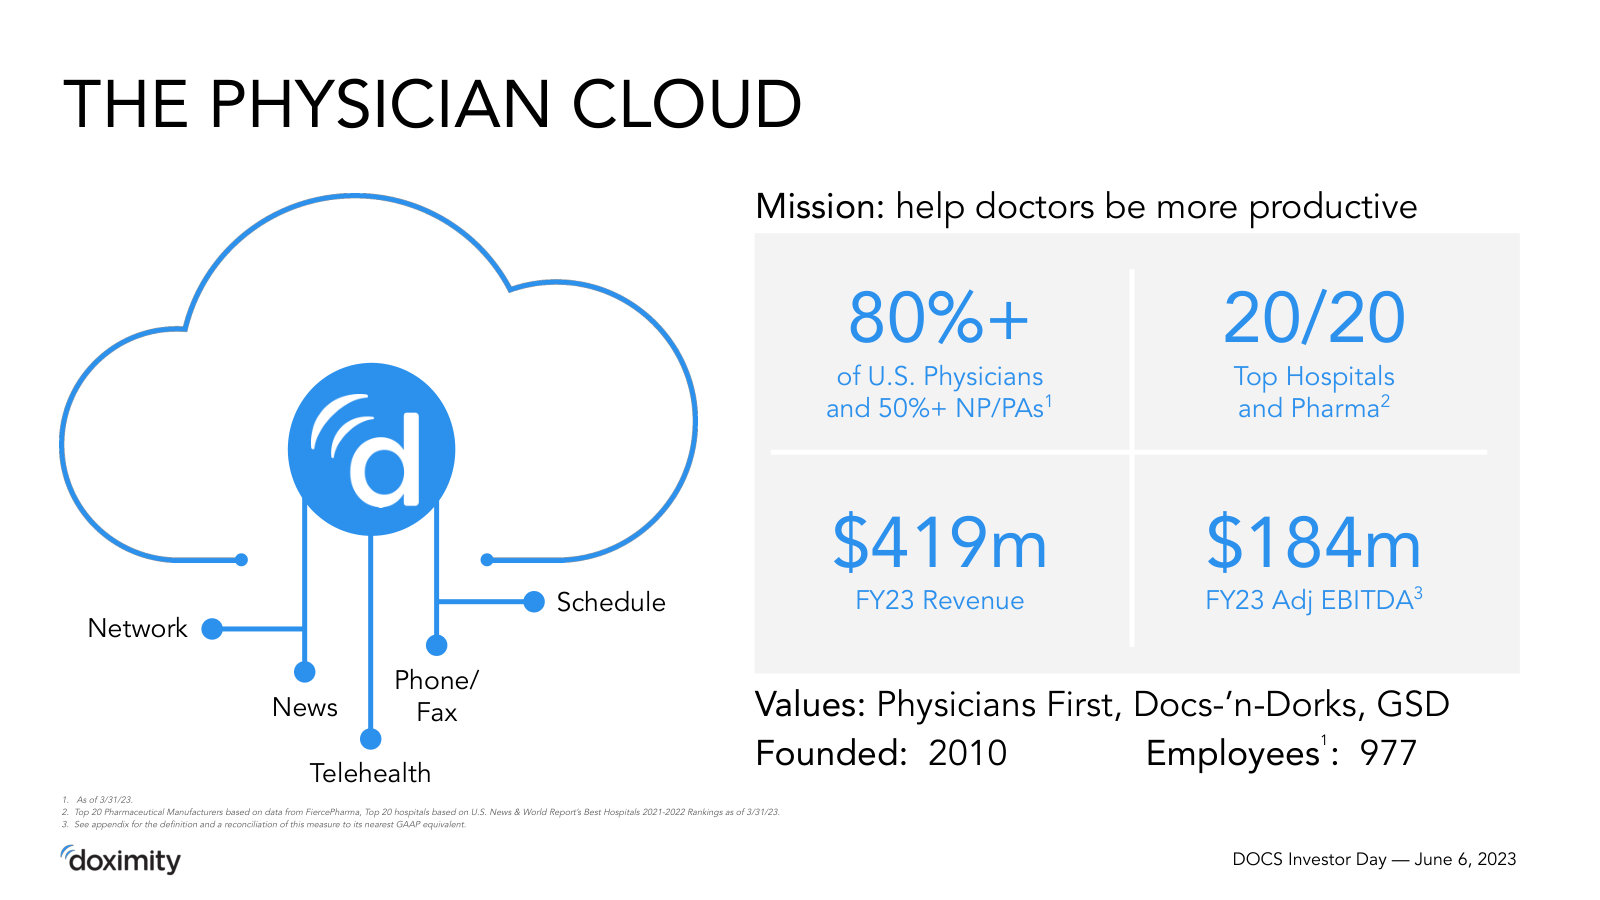
Same mission, framed as a 'physician cloud' of telehealth and workflow tools — no Clinical AI Suite, two million members not three.
FY2022 scale and reach: over two million members, 80%+ of U.S. physicians.
We are the leading digital platform for U.S. medical professionals, as measured by the number of U.S. physician members, with over two million medical professional members as of March 31, 2022. Our members include more than 80% of physicians across all 50 states and every medical specialty, as well as over 50% of U.S. nurse practitioners and physician assistants, and over 90% of graduating U.S. medical students.
p. 8 · Read in context →
The 'physician cloud' framing that predates the AI-first repositioning.
Doximity’s physician cloud puts modern software tools in the hands of physicians and other medical professionals. We provide our members with capabilities specifically built for medical professionals, enabling them to collaborate with their colleagues, securely coordinate patient care, conduct virtual patient visits, stay up-to-date with the latest medical news and research, and manage their careers.
p. 8 · Read in context →
More annual reports
Doximity, Inc. — FY2025 Annual Report (Form 10-K) — FY2025 · 162 pages · Peak-margin year (39% net margin, 20% growth, 119% NRR) — the comparison base for the FY2026 deceleration. · Open →
Doximity, Inc. — FY2024 Annual Report (Form 10-K) — FY2024 · 166 pages · Restructuring-charge year; early Clinical AI (DoxGPT) language begins appearing in the business description. · Open →
Doximity, Inc. — FY2023 Annual Report (Form 10-K) — FY2023 · 165 pages · First full post-IPO year; useful for tracking member growth and the pre-AI product mix. · Open →
Competitors describe Doximity, Inc.'s market in their own filings and calls. These verified passages and visual pages show where their strategies meet, using source documents preserved in Sources.
OptimizeRx Corporation (OPRX)
The purest-play rival to Doximity's core pharmaceutical-marketing segment: OptimizeRx sells digital messaging that reaches physicians on behalf of drug manufacturers, competing for the same pharma media budgets. It reaches HCPs by embedding in EHR/e-prescribe and point-of-care workflows rather than through a login-based member network — the key structural contrast with Doximity.
OptimizeRx's sizing of the market Doximity's marketing segment sells into: it cites eMarketer putting total U.S. pharmaceutical-industry digital spend above $20 billion.
According to eMarketer, total pharmaceutical industry digital spend in the United States is now over $20 billion.
p. 10 · Read in context →
OptimizeRx's own map of the competitive set — 'walled garden' platforms and 'advertising networks that aggregate traffic from… point-of-care platforms,' the category Doximity's physician network occupies — capped by its claim of 'unparalleled reach to relevant prescribers.'
We compete broadly in the dynamic and ever-evolving pharmaceutical and life sciences digital marketing industry with healthcare data suppliers, health-focused demand-side platforms, and health-focused walled garden websites and web platforms, and advertising networks that aggregate traffic from multiple web sites or point-of-care platforms such as telehealth, EHR, eRx, physician practice management […] Our extensive point-of-care network provides our customers with unparalleled reach to relevant prescribers.
p. 13 · Read in context →
Asked about the competitive landscape, OptimizeRx's CEO frames the company as one of the few able to reach clinicians and patients digitally at scale — a leadership claim that runs directly against Doximity's own network-reach positioning.
Stephen L. Silvestro, Chief Executive Officer: the most important thing you're looking for is the ability to continue to connect with doctors and patients in a digital way that's efficient. And we are still one of the only players out there that can do it. We are arguably the only player that can really do it at scale across DTC and HCP.
p. 7 · Read in context →
Phreesia, Inc. (PHR)
Phreesia monetizes a healthcare audience for pharma-marketing dollars through its Network Solutions segment, and in 2026 extended from patient-facing point-of-care advertising into physician (HCP) marketing with ProviderConnect — moving directly onto Doximity's home turf of reaching doctors for drug manufacturers.
Phreesia sizes its addressable market at roughly $24 billion, attributing $8.2 billion to Network solutions — the pharma provider- and patient-marketing spend that overlaps Doximity's marketing business.
We estimate our total addressable market at approximately $24 billion […] an estimated potential $8.2 billion in Network solutions revenue, based on projections of healthcare provider marketing spend, direct-to-consumer point-of-care marketing spend and other digital, direct-to-consumer life sciences marketing spend.
p. 12 · Read in context →
Phreesia's CEO announces ProviderConnect, extending the company from patient-facing point-of-care media into physician (HCP) marketing — the segment Doximity's marketing business is built on.
Chaim Indig, Chief Executive Officer: in early March, we announced the launch of ProviderConnect, a first-of-itskind offering for healthcare provider marketers. This is a natural extension of what we have built with PatientConnect, one of the most trusted and effective point-of-care media offerings in the industry.
p. 1 · Read in context →
Definitive Healthcare Corp (DH)
Definitive Healthcare sells provider/physician data and commercial intelligence to life-sciences companies, and is pushing from static data into digital 'audience activation' — advertising to physicians for pharma — an adjacency that increasingly overlaps Doximity's data-driven marketing segment.
Definitive Healthcare's sizing of the healthcare commercial-intelligence market it shares with Doximity's data/marketing offerings: a total addressable market above $11 billion, a ~$7 billion serviceable market, and 100,000+ potential customers.
contributes to our estimated current total addressable market of over $11 billion and our serviceable addressable market of approximately $7 billion […] we have identified more than 100,000 potential customers that we believe could benefit from our platform.
p. 83 · Read in context →
Definitive Healthcare describes its move into digital 'audience' advertising — 30+ agencies signed, and a cited benchmark of a 63% higher click-through rate 'than a leading competitor' — pushing into the physician-marketing space Doximity occupies.
Kevin Coop, Chief Executive Officer: we now have more than 30 agencies signed up, with more than half of them actively generating bookings for Definitive Healthcare Corp. […] a recent benchmark by a leading biopharma solutions company which showed our audience delivered a 63% higher click-through rate than a leading competitor.
p. 1 · Read in context →
Definitive Healthcare details distributing its provider audiences for programmatic activation across The Trade Desk, Yahoo! DSP, Reddit and LiveRamp — building an ad-tech channel to monetize physician data, adjacent to Doximity's marketing model.
Kevin Coop, Chief Executive Officer: This platform helps distribute off-the shelf and fully customizable audiences for activation on a variety of platforms such as The Trade Desk, Yahoo! DSP, Reddit or data marketplaces like LiveRamp.
p. 3 · Read in context →
Teladoc Health, Inc. (TDOC)
Teladoc is the largest U.S. virtual-care company; it overlaps Doximity where Doximity offers physicians telehealth (Dialer/video) and is building AI clinical-workflow tools. Teladoc contracts its own clinician network and sells to employers and health plans — a heavier model than Doximity's free-to-clinician tooling.
Teladoc's self-description as 'the global leader in virtual care,' with 17.1 million telehealth visits in 2025 — the scale of the virtual-care market Doximity's telehealth tools touch at the margin.
Teladoc Health is the global leader in virtual care. […] we completed 17.1 million telehealth visits in 2025 through our business-to-business (“B2B”) and direct-to-consumer (“D2C”) channels.
p. 4 · Read in context →
Teladoc's CEO sizes its enterprise base at 12,000+ organizations and lays out an AI-in-care strategy — matching members to providers and giving clinicians 'ambient-generated documentation' — the same AI clinical-workflow ground Doximity is entering.
Charles Divita, Chief Executive Officer: With an extensive, diverse and well-established client base of over 12,000 organizations, our partners and patients look to us to deliver quality experiences that perform and endure. […] In clinical settings, AI helps connect members to the right provider, supports clinicians with ambient-generated documentation and informs next best actions for our members.
p. 3 · Read in context →
Teladoc's competition risk factor acknowledges rivals offering solutions 'at substantially lower prices' and well-financed entrants providing tools 'at discounted prices' — the free-to-clinician wedge Doximity's telehealth tooling exploits.
We currently face competition in the virtual care industry for our solutions from a range of companies, including specialized software and solution providers that offer competitive solutions, often at substantially lower prices […] large, well-financed health plans, technology companies and retailers have in some cases developed or acquired their own tools and may provide these solutions to their customers at discounted prices.
p. 40 · Read in context →
AMN Healthcare Services, Inc. (AMN)
AMN is the largest U.S. healthcare-staffing firm and the incumbent model Doximity's Hiring segment disrupts: where AMN places physicians and clinicians through agencies and locum-tenens, Doximity offers health systems self-serve digital recruiting into its physician network.
AMN describes and claims leadership across the physician-staffing markets — locum tenens and physician permanent placement — that Doximity's Hiring segment targets; its named rivals are all traditional staffing agencies, not digital-network recruiters.
We are a leading provider of nurse, allied and locum tenens staffing in the United States. […] The locum tenens staffing market consists of many small- to mid-sized companies with only a small number of national competitors of which we are one.
p. 12 · Read in context →
AMN's risk factor flags exactly Doximity's model as a threat: clients using 'analytics, automation… artificial intelligence' or internal/online recruiting to raise hiring effectiveness, reducing the need for agency staffing.
If our clients are able to increase the effectiveness of their staffing and recruitment functions through analytics, automation, machine learning, artificial intelligence (“AI”) or other advanced technologies or otherwise increase the effectiveness of their permanent hiring or retention of permanent employees, their need for our services may decline.
p. 14 · Read in context →
Cross Country Healthcare, Inc. (CCRN)
Another incumbent healthcare-staffing firm overlapping Doximity Hiring in clinician (including physician/locum) recruitment; it is repositioning from labor-arbitrage staffing toward a technology-platform model as hospitals move to source clinicians directly.
Cross Country sizes the U.S. healthcare-staffing market (citing Staffing Industry Analysts) at $39.4 billion, including a $9.6 billion locum-tenens and advanced-practitioner pool — the physician-staffing segment Doximity Hiring targets.
Staffing Industry Analysts’ September 2025 report estimates the 2025 healthcare staffing markets had an aggregate market size of $39.4 billion, of which $14.2 billion was travel nursing, $4.5 billion was per diem nursing, $9.8 billion was allied health, and $9.6 billion was locum tenens and advanced practitioners.
p. 14 · Read in context →
Cross Country's CEO reframes the company as 'a technology firm that offers staffing solutions' that can help clients 'build their own talent pool' — the direct-sourcing/disintermediation dynamic underlying Doximity Hiring's thesis.
Kevin Clark, Chairman & Chief Executive Officer: Our strength lies in not being just a staffin company; we are a technology firm that offers staffing solutions. We assist our customers in various ways, whether it's by helping them build their own talent pool, managing that talent pool with our technology, or working with them as either a primary vendor or in a vendor neutral capacity.
p. 8 · Read in context →
More peer documents
OptimizeRx Q1 FY2026 call — opening HCP inventory to programmatic DSPs — 8 pages · CEO says OPRX is enabling demand-side platforms that control 80%+ of digital promotional dollars to buy its HCP network directly — a supply-side pivot for pharma media budgets Doximity also chases. · Open →
Cross Country Q2 FY2024 call — hospitals self-sourcing clinician pools — 13 pages · CEO describes hospitals managing internal float pools 'on Excel spreadsheets' and moving to direct-source their own clinicians — the structural tailwind Doximity Hiring rides. · Open →
Source: S&P Capital IQ consensus via Xpressfeed · Generated 2026-07-20.
Street snapshot
Eighteen analysts carry price targets averaging $24.56 (median $23.50) across a wide $18–$42 range.
Currency: USD · Scale: money in millions, absolute (per share) · Analyst counts shown explicitly; recommendation respondents: 21.
| Street view | Reading | Analysts |
|---|---|---|
| Recommendation mix | Buy 4, Outperform 5, Hold 11, Underperform 1, Sell 0 | 21 |
| Consensus score | 2.43 | 21 |
| Target price | mean 24.56; high 42.00; low 18.00 | 18 |
Forward table
After FY2026 revenue of $644.9M, consensus sees growth cooling to about $670.3M in FY2027 before reaccelerating to $712.4M in FY2028. Normalized EPS dips from $1.55 to $1.43 in FY2027 and recovers to $1.59 in FY2028, while gross margin holds near 90% and no dividend is modeled.
Currency: USD · Scale: money in millions, absolute (per share) · Analyst count is the estimate count for each period and metric.
| Period | Metric | Mean | YoY | Analysts | Low / high |
|---|---|---|---|---|---|
| FY0E | Revenue | 670.3 | 4.0% | 20 | 664.2 / 676.0 |
| FY0E | EBITDA | 329.2 | -8.0% | 18 | 321.9 / 340.6 |
| FY0E | EBIT | 318.0 | -8.6% | — | — / — |
| FY0E | Net income (GAAP) | 151.4 | -22.8% | 10 | 92.79 / 180.2 |
| FY0E | Net income (normalized) | 276.9 | -9.7% | — | — / — |
| FY0E | EPS (GAAP) | 0.78 | -20.3% | 11 | 0.58 / 0.92 |
| FY0E | EPS (normalized) | 1.43 | -5.7% | 18 | 1.28 / 1.54 |
| FY0E | Free cash flow | 279.0 | -9.3% | — | — / — |
| FY0E | Dividend per share | 0.00 | — | — | — / — |
| FY0E | Gross margin | 88.1% | -2.9% | — | — / — |
| FY0E | Capital expenditure | -0.72 | 545.4% | — | — / — |
| FY0E | Net debt | -853.4 | 20.9% | — | — / — |
| FY0E | Cash from operations | 289.9 | -7.4% | — | — / — |
| FY0E | ROE | 28.5% | -1.7% | — | — / — |
| FY+1E | Revenue | 712.4 | 6.3% | 16 | 689.4 / 743.3 |
| FY+1E | EBITDA | 358.1 | 8.8% | 14 | 333.1 / 391.4 |
| FY+1E | EBIT | 345.0 | 8.5% | — | — / — |
| FY+1E | Net income (GAAP) | 175.0 | 15.6% | 7 | 126.5 / 224.3 |
| FY+1E | Net income (normalized) | 303.3 | 9.5% | — | — / — |
| FY+1E | EPS (GAAP) | 0.98 | 25.9% | 7 | 0.84 / 1.14 |
| FY+1E | EPS (normalized) | 1.59 | 11.2% | 15 | 1.41 / 1.75 |
| FY+1E | Free cash flow | 302.2 | 8.3% | — | — / — |
| FY+1E | Gross margin | 88.6% | 0.6% | — | — / — |
| FY+1E | Capital expenditure | -0.72 | 0.0% | — | — / — |
| FY+1E | Net debt | -1,098 | 28.6% | — | — / — |
| FY+1E | Cash from operations | 316.9 | 9.3% | — | — / — |
| FY+1E | ROE | 29.1% | 1.9% | — | — / — |
| FY+2E | Revenue | 767.6 | 7.7% | 7 | 729.9 / 827.4 |
| FY+2E | EBITDA | 395.0 | 10.3% | 6 | 341.9 / 441.1 |
| FY+2E | EBIT | 379.8 | 10.1% | — | — / — |
| FY+2E | Net income (GAAP) | 212.2 | 21.3% | 3 | 166.6 / 249.9 |
| FY+2E | Net income (normalized) | 339.2 | 11.8% | — | — / — |
| FY+2E | EPS (GAAP) | 1.19 | 21.4% | 3 | 1.04 / 1.27 |
| FY+2E | EPS (normalized) | 1.82 | 14.5% | 7 | 1.62 / 2.00 |
| FY+2E | Free cash flow | 318.8 | 5.5% | — | — / — |
| FY+2E | Gross margin | 88.8% | 0.2% | — | — / — |
| FY+2E | Capital expenditure | -5.00 | 589.7% | — | — / — |
| FY+2E | Net debt | -834.8 | -23.9% | — | — / — |
| FY+2E | ROE | 27.9% | -3.9% | — | — / — |
| FY+2E | Cash from operations | 345.8 | 9.1% | — | — / — |
| Q1 FY2027 | Revenue | 151.7 | 4.0% | 19 | 151.0 / 155.0 |
| Q1 FY2027 | EBITDA | 69.59 | -12.8% | 17 | 68.70 / 71.90 |
| Q1 FY2027 | EBIT | 67.11 | -4.0% | — | — / — |
| Q1 FY2027 | Net income (GAAP) | 29.48 | -44.7% | 8 | 20.35 / 36.30 |
| Q1 FY2027 | Net income (normalized) | 59.13 | -4.8% | — | — / — |
| Q1 FY2027 | EPS (GAAP) | 0.15 | -42.8% | 11 | 0.11 / 0.19 |
| Q1 FY2027 | EPS (normalized) | 0.30 | -15.9% | 18 | 0.28 / 0.33 |
| Q1 FY2027 | Free cash flow | 53.97 | -23.9% | — | — / — |
| Q1 FY2027 | Gross margin | 87.9% | -3.4% | — | — / — |
| Q1 FY2027 | Capital expenditure | -0.50 | -9.1% | — | — / — |
| Q1 FY2027 | Net debt | -771.5 | -20.8% | — | — / — |
| Q1 FY2027 | Cash from operations | 56.10 | -22.9% | — | — / — |
| Q2 FY2027 | Revenue | 171.8 | 1.9% | 19 | 164.0 / 183.4 |
| Q2 FY2027 | EBITDA | 86.63 | -14.1% | 17 | 77.50 / 96.02 |
| Q2 FY2027 | EBIT | 84.81 | -0.7% | — | — / — |
| Q2 FY2027 | Net income (GAAP) | 38.55 | -37.9% | 8 | 23.23 / 44.89 |
| Q2 FY2027 | Net income (normalized) | 72.63 | -4.4% | — | — / — |
| Q2 FY2027 | EPS (GAAP) | 0.21 | -32.0% | 11 | 0.16 / 0.25 |
| Q2 FY2027 | EPS (normalized) | 0.37 | -17.1% | 18 | 0.32 / 0.42 |
| Q2 FY2027 | Free cash flow | 57.95 | -35.2% | — | — / — |
| Q2 FY2027 | Gross margin | 88.2% | -3.5% | — | — / — |
| Q2 FY2027 | Capital expenditure | -0.47 | -5.0% | — | — / — |
| Q2 FY2027 | Net debt | -803.5 | -9.7% | — | — / — |
| Q2 FY2027 | Cash from operations | 60.35 | -33.8% | — | — / — |
| Q3 FY2027 | Revenue | 193.0 | 4.3% | 19 | 184.2 / 200.6 |
| Q3 FY2027 | EBITDA | 103.1 | -7.5% | 17 | 95.67 / 110.8 |
| Q3 FY2027 | EBIT | 99.66 | -2.4% | — | — / — |
| Q3 FY2027 | Net income (GAAP) | 51.38 | -16.5% | 8 | 33.92 / 62.10 |
| Q3 FY2027 | Net income (normalized) | 85.08 | -5.4% | — | — / — |
| Q3 FY2027 | EPS (GAAP) | 0.27 | -13.2% | 11 | 0.19 / 0.32 |
| Q3 FY2027 | EPS (normalized) | 0.44 | -4.0% | 18 | 0.42 / 0.47 |
| Q3 FY2027 | Free cash flow | 54.01 | -53.0% | — | — / — |
| Q3 FY2027 | Gross margin | 88.3% | -3.8% | — | — / — |
| Q3 FY2027 | Capital expenditure | -0.23 | 80.0% | — | — / — |
| Q3 FY2027 | Net debt | -837.0 | -12.2% | — | — / — |
| Q3 FY2027 | Cash from operations | 56.37 | -51.7% | — | — / — |
| Q4 FY2027 | Revenue | 154.0 | 5.9% | 18 | 147.3 / 164.1 |
| Q4 FY2027 | EBITDA | 70.09 | 6.5% | 16 | 58.38 / 83.20 |
| Q4 FY2027 | EBIT | 66.60 | 7.4% | — | — / — |
| Q4 FY2027 | Net income (GAAP) | 29.30 | 53.3% | 8 | 13.90 / 40.31 |
| Q4 FY2027 | Net income (normalized) | 60.95 | 9.7% | — | — / — |
| Q4 FY2027 | EPS (GAAP) | 0.15 | 47.3% | 11 | 0.05 / 0.21 |
| Q4 FY2027 | EPS (normalized) | 0.31 | 20.8% | 17 | 0.23 / 0.36 |
| Q4 FY2027 | Free cash flow | 91.84 | -8.3% | — | — / — |
| Q4 FY2027 | Gross margin | 87.4% | -2.1% | — | — / — |
| Q4 FY2027 | Capital expenditure | -0.25 | 81.8% | — | — / — |
| Q4 FY2027 | Net debt | -905.2 | 8.5% | — | — / — |
| Q4 FY2027 | Cash from operations | 93.95 | -7.7% | — | — / — |
Estimate momentum
Currency: USD · Scale: money in millions, absolute (per share) · Point-in-time consensus; analyst count is shown where supplied.
| Period | Metric | Lookback | Then | Now | Direction / magnitude | Analysts |
|---|---|---|---|---|---|---|
| 2027 | Revenue | 30d | 670.5 | 670.3 | down 0.0% | — |
| 2027 | Revenue | 90d | 697.5 | 670.3 | down 3.9% | — |
| 2027 | Revenue | 180d | 717.4 | 670.3 | down 6.6% | — |
| 2028 | Revenue | 30d | 713.0 | 712.4 | down 0.1% | — |
| 2028 | Revenue | 90d | 762.3 | 712.4 | down 6.6% | — |
| 2028 | Revenue | 180d | 794.7 | 712.4 | down 10.4% | — |
| 2027 | EPS (normalized) | 30d | 1.43 | 1.43 | up 0.0% | — |
| 2027 | EPS (normalized) | 90d | 1.62 | 1.43 | down 11.6% | — |
| 2027 | EPS (normalized) | 180d | 1.72 | 1.43 | down 16.8% | — |
| 2028 | EPS (normalized) | 30d | 1.60 | 1.59 | down 0.2% | — |
| 2028 | EPS (normalized) | 90d | 1.79 | 1.59 | down 10.9% | — |
| 2028 | EPS (normalized) | 180d | 1.94 | 1.59 | down 17.9% | — |
Beat / miss record
Current sequences by metric: Revenue: 8 consecutive beats; EPS (normalized): 1 consecutive miss.
Currency: USD · Scale: money in millions, absolute (per share) · Consensus is captured before each actual first became effective; analyst count shown per observation.
| Quarter | Metric | Consensus as of | Actual | Surprise | Outcome | Analysts |
|---|---|---|---|---|---|---|
| Q4 FY2026 | Revenue | 143.9 | 145.4 | 1.0% | Beat | — |
| Q4 FY2026 | EPS (normalized) | 0.28 | 0.26 | -7.9% | Miss | — |
| Q3 FY2026 | Revenue | 181.6 | 185.1 | 1.9% | Beat | — |
| Q3 FY2026 | EPS (normalized) | 0.45 | 0.46 | 2.9% | Beat | — |
| Q2 FY2026 | Revenue | 157.6 | 168.5 | 6.9% | Beat | — |
| Q2 FY2026 | EPS (normalized) | 0.38 | 0.45 | 18.7% | Beat | — |
| Q1 FY2026 | Revenue | 139.6 | 145.9 | 4.5% | Beat | — |
| Q1 FY2026 | EPS (normalized) | 0.31 | 0.36 | 17.2% | Beat | — |
| Q4 FY2025 | Revenue | 134.0 | 138.3 | 3.2% | Beat | — |
| Q4 FY2025 | EPS (normalized) | 0.27 | 0.38 | 39.3% | Beat | — |
| Q3 FY2025 | Revenue | 152.8 | 168.6 | 10.3% | Beat | — |
| Q3 FY2025 | EPS (normalized) | 0.34 | 0.45 | 34.0% | Beat | — |
| Q2 FY2025 | Revenue | 127.2 | 136.8 | 7.6% | Beat | — |
| Q2 FY2025 | EPS (normalized) | 0.26 | 0.30 | 17.0% | Beat | — |
| Q1 FY2025 | Revenue | 119.9 | 126.7 | 5.7% | Beat | — |
| Q1 FY2025 | EPS (normalized) | 0.23 | 0.28 | 24.4% | Beat | — |
Where the street disagrees
Disagreement is widest on GAAP net income: FY2027 estimates span $92.8M to $180.2M across just 10 analysts and FY2028 $126.5M to $224.3M across 7, so the out-year signal is thin.
Currency: USD · Scale: money in millions, absolute (per share) · Dispersion is high-low divided by absolute mean; analyst count shown per item.
| Period | Metric | Mean | Low | High | Spread / mean | Analysts |
|---|---|---|---|---|---|---|
| Q4 FY2026 | EPS (GAAP) | 0.17 | 0.12 | 0.33 | 121.8% | 13 |
| Q4 FY2027 | EPS (GAAP) | 0.15 | 0.05 | 0.21 | 108.6% | 11 |
| Q4 FY2027 | Net income (GAAP) | 29.30 | 13.90 | 40.31 | 90.2% | 8 |
| 2027 | Net income (GAAP) | 151.4 | 92.79 | 180.2 | 57.7% | 10 |
| Q2 FY2027 | Net income (GAAP) | 38.55 | 23.23 | 44.89 | 56.2% | 8 |
Source: Visible Alpha consensus via S&P Xpressfeed · Consensus as of 2026-07-16 · generated 2026-07-20.
Model trust
The freshest revisions land in mid-July 2026, so the set is current rather than stale, though some line items still carry older revision dates and are treated as such.
Base currency: USD · VA scales normalized from Abs, K, M; item currencies and units retained · Coverage depth and vintage; broker count is the maximum represented.
| Brokers | Line items | Last revision |
|---|---|---|
| 19 | 328 | 2026-07-16 |
Operating KPIs
Base currency: USD · VA scales normalized from Abs, K, M; item currencies and units retained · FY-1A / FY0E / FY+1E; broker count shown per KPI.
| Operating KPI | Source | FY-1A | FY0E | FY+1E | Brokers |
|---|---|---|---|---|---|
| Accounts payable and accrued expenses | CD | — | 42,833.51bn Amount | 42,456.13bn Amount | 17 |
| Accounts receivable | CD | — | 126,831.33bn Amount | 142,423.65bn Amount | 17 |
| Analyst FCF | CD | — | 310,777.34bn Amount | 290,654.14bn Amount | 17 |
| Capitalized internal use software | CD | — | 8,690.48bn Amount | 9,020.97bn Amount | 17 |
| Changes in working capital | CD | — | -19,481.86bn Amount | -9,155.54bn Amount | 17 |
| D&A | CD | — | 12,211.61bn Amount | 13,373.74bn Amount | 17 |
| Deferred revenue current | CD | — | 87,769.83bn Amount | 112,846.35bn Amount | 17 |
| Depreciation and amortization | CD | — | 13,396.48bn Amount | 14,230.71bn Amount | 17 |
| Net earnings/(loss) | CD | — | 214,601.36bn Amount | 153,565.74bn Amount | 17 |
| Nonoperating income/(expense) | CD | — | 32,941.16bn Amount | 32,145.64bn Amount | 17 |
| Other revenue | CD | — | 35,764.86bn Amount | 39,242.81bn Amount | 17 |
| Prepaid expenses and other current assets | CD | — | 73,325.10bn Amount | 50,104.07bn Amount | 17 |
P&L bridge
Gross margin eases from roughly 91% toward 88% over the horizon.
Base currency: USD · VA scales normalized from Abs, K, M; item currencies and units retained · Margins are derived against revenue; YoY compares adjacent fiscal columns; broker count shown per line.
| P&L line | FY-1A | FY0E | FY+1E | Brokers |
|---|---|---|---|---|
| Revenue | — | 643,414.55bn Amount | 672,216.11bn Amount (4.5% YoY) | 19 |
| Gross Profit | — | 584,619.53bn Amount (90.9% margin) | 592,893.43bn Amount (88.2% margin; 1.4% YoY) | 19 |
| Ebitda | — | 356,290.35bn Amount (55.4% margin) | 331,470.70bn Amount (49.3% margin; -7.0% YoY) | 19 |
| Operating Income | — | 341,420.23bn Amount (53.1% margin) | 313,297.37bn Amount (46.6% margin; -8.2% YoY) | 19 |
| Net Income | — | 297,911.72bn Amount (46.3% margin) | 263,296.01bn Amount (39.2% margin; -11.6% YoY) | 19 |
| Eps | — | 1.49 Amount | 1.35 Amount (-9.1% YoY) | 19 |
Consensus dispersion
Base currency: USD · VA scales normalized from Abs, K, M; item currencies and units retained · Top high-low spreads relative to absolute mean; requires at least 3 brokers.
| Line item | Period | Mean | Min | Q1 | Q3 | Max | Spread / mean | Brokers |
|---|---|---|---|---|---|---|---|---|
| Changes in working capital | FY-2028 | 574.35bn Amount | -26,068.31bn Amount | -10,847.18bn Amount | 7,262.29bn Amount | 37,425.92bn Amount | 11055.0% | 14 |
| Changes in working capital | 1QFY-2028 | -5,133.41bn Amount | -97,108.78bn Amount | -8,969.61bn Amount | 6,465.87bn Amount | 30,856.57bn Amount | 2492.8% | 10 |
| Changes in working capital | FY-2027 | -9,155.54bn Amount | -126,404.61bn Amount | -18,672.77bn Amount | 5,523.00bn Amount | 78,183.58bn Amount | 2234.6% | 16 |
| Changes in working capital | 1QFY-2027 | -9,129.11bn Amount | -131,637.81bn Amount | -18,081.79bn Amount | 12,020.29bn Amount | 52,584.55bn Amount | 2018.0% | 12 |
| Changes in working capital | FY-2026 | -19,481.86bn Amount | -124,941.42bn Amount | -36,309.29bn Amount | -6,047.10bn Amount | 64,249.04bn Amount | 971.1% | 17 |
| Changes in working capital | 2QFY-2026 | 5,617.19bn Amount | -15,264.00bn Amount | -6,190.07bn Amount | 17,621.50bn Amount | 33,124.20bn Amount | 861.4% | 12 |
Quarterly path
Base currency: USD · VA scales normalized from Abs, K, M; item currencies and units retained · Next four supplied quarters; final column is maximum broker coverage in the row.
| Quarter | Accounts payable and accrued expenses | Accounts receivable | Analyst FCF | Capitalized internal use software | Changes in working capital | Total revenue | EPS Diluted, Applicable to common stockholders($) | Broker coverage |
|---|---|---|---|---|---|---|---|---|
| 2QFY-2027 | 40,793.26bn Amount | 141,147.16bn Amount | 68,184.05bn Amount | 2,181.78bn Amount | -9,306.26bn Amount | 170,847.97bn Amount | 0.36 Amount | 18 |
| 3QFY-2027 | 52,848.48bn Amount | 156,422.09bn Amount | 75,508.82bn Amount | 2,276.08bn Amount | -15,007.58bn Amount | 192,300.08bn Amount | 0.42 Amount | 18 |
| 4QFY-2027 | 40,047.57bn Amount | 139,254.44bn Amount | 91,664.93bn Amount | 2,003.58bn Amount | 28,421.83bn Amount | 155,674.46bn Amount | 0.29 Amount | 18 |
| 1QFY-2028 | 42,520.64bn Amount | 143,241.54bn Amount | 65,267.30bn Amount | 2,231.36bn Amount | -5,133.41bn Amount | 160,472.23bn Amount | 0.33 Amount | 12 |
357 stale period values omitted; 4 line items fully removed.
Source: S&P Capital IQ transcripts via Xpressfeed · latest indexed call 2026-05-13 · generated 2026-07-20.
Latest call digest
Doximity, Inc., Q4 2026 Earnings Call, May 13, 2026 · 2026-05-13T21:00:00
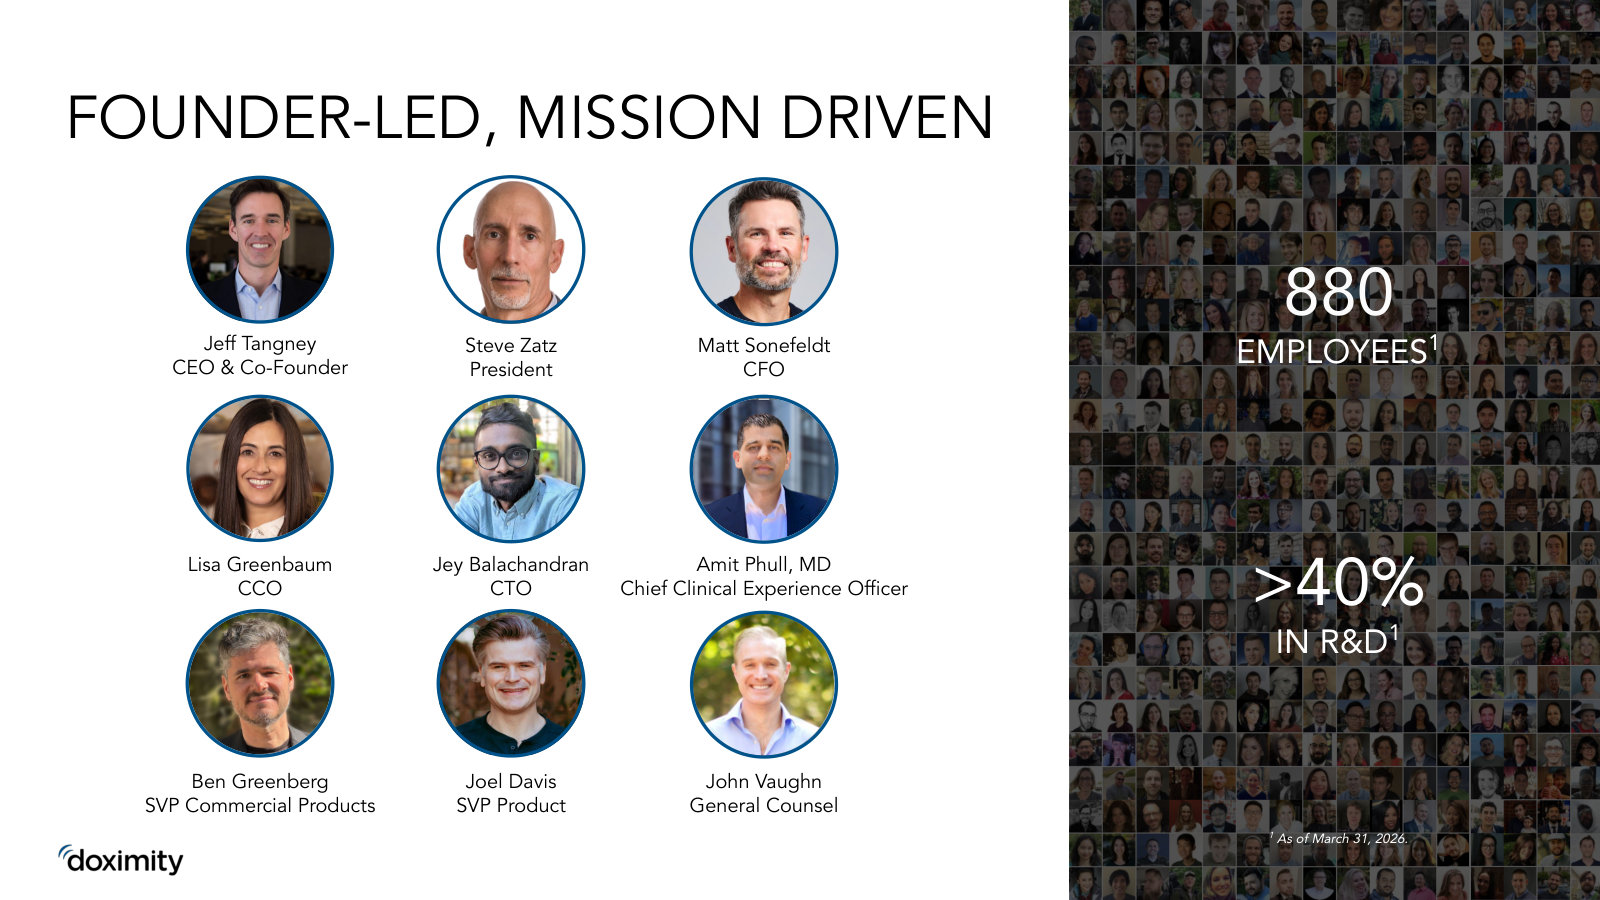
Doximity's Q4 FY2026 call (May 13, 2026) closed a year management reframed as its "AI investment year." Prepared remarks led with strength: a record $107 million free-cash-flow quarter (its first nine-digit FCF quarter), full-year revenue of $645 million (+13%), workflow active prescribers up roughly 30% to over 800,000, and 140 health systems now buying the clinical AI suite. CEO Jeff Tangney also announced the commercial launch of a paid AI Search product for pharma and two leadership changes — Matt Sonefeldt as CFO (succeeding Anna Bryson, who stepped down after medical leave) and Steve Zatz as President.
The Q&A reality was more sober. Q4 revenue grew just 5%, FY27 is guided to only ~4% growth with adjusted-EBITDA margin stepping down to ~49%, and trailing-12-month net revenue retention slipped to 109% from 118% a year earlier. Management attributes the slowdown to a soft HCP digital-pharma ad market, limited visibility, shorter-duration client commitments, and elevated policy and macro risk (including a reference to a war in Iran). AI Search is positioned as the key new growth lever, but management guided to minimal AI revenue in the first half and a ramp only in the fiscal back half, pending regulatory and med-legal review. The stated outlook: Q1 FY27 revenue $151–152 million (+4% at midpoint), full-year revenue $664–676 million (+4% at midpoint), FY27 adjusted-EBITDA margin ~49% with a commitment to the high-40s or better, and stock-based comp rising to the low-20s percent of revenue.
Participant coverage from the latest call.
| Group | Participants | Count |
|---|---|---|
| Management | Operator; Perry Gold — Head of Investor Relations, Doximity, Inc.; Jeffrey Tangney — Co-Founder, CEO & Chairperson, Doximity, Inc.; Matt Sonefeldt | 4 |
| Analysts | Brian Peterson — Managing Director, Raymond James & Associates, Inc., Research Division; Michael Cherny — Senior Research Analyst and Senior MD of Healthcare Technology & Distribution, Leerink Partners LLC, Research Division; Glen Santangelo — Research Analyst, Barclays Bank PLC, Research Division; Elizabeth Anderson — Managing Director & Fundamental Research Analyst, Evercore ISI Institutional Equities, Research Division; Ryan MacDonald — Senior Analyst, Needham & Company, LLC, Research Division; Craig Hettenbach — VP & Equity Analyst, Morgan Stanley, Research Division; Richard Close — MD & Senior Analyst, Canaccord Genuity Corp., Research Division; Ryan Halsted — MD & Healthcare Technology & Distribution Analyst, RBC Capital Markets, Research Division; Steven Valiquette — MD & Senior Equity Research Analyst, Mizuho Securities USA LLC, Research Division; David Roman — Research Analyst, Goldman Sachs Group, Inc., Research Division; Scott Schoenhaus — MD & Equity Research Analyst, KeyBanc Capital Markets Inc., Research Division | 11 |
Curated latest-call exchanges; one row per analyst topic.
| Analyst | Firm | Topic | What changed in Q&A |
|---|---|---|---|
| Brian Peterson | Raymond James & Associates | AI Search TAM and pharma appetite | Pressed on how large the AI products could be over a 2-3 year horizon; Tangney framed a multibillion-dollar new TAM on top of existing pharma paid-search budgets, but stressed it is early and regulated. |
| Glen Santangelo | Barclays | HCP ad regulatory concerns and AI Search economics | Asked what is driving pharma hesitation and how AI paid-search competition and margins differ; Tangney tied 'regulatory' mainly to keyword and suppression-word review on the new AI product rather than a broad regime change. |
| Ryan Halsted | RBC Capital Markets | Record January bookings pace versus a slower guide | Questioned why record early bookings did not translate into the guide; Gold said January is the smallest bookings month and demand had softened incrementally since the prior call. |
| David Roman | Goldman Sachs | Falling net revenue retention and 'doing more with less' | Asked how investors should be reassured pharma isn't permanently doing more with less as retention slips; Tangney argued Doximity is 'the more' given its ROI. |
| Scott Schoenhaus | KeyBanc Capital Markets | In-line-with-market growth versus the historic 2x | Probed the gap versus the long-standing ~2x-market outgrowth; Gold cited the late AI-Search launch timing and a refusal to chase low-cost buys. |
| Elizabeth Anderson | Evercore ISI | FY27 margin structure and the new CFO | Asked whether the Q4 margin is the FY27 run-rate; Gold pointed to higher AI compute, PeerCheck and brand-marketing spend as the drivers of the step-down. |
Theme tracker
Themes are curator-classified across supplied calls.
| Theme | Status | Quarters mentioned | Read-through |
|---|---|---|---|
| AI clinical suite build-out (Scribe, DocsGPT, Pathway) | persisted | Q1 2026, Q2 2026, Q3 2026, Q4 2026 | The through-line of the year: a free, physician-first AI reference and scribe (post-Pathway acquisition) that scaled from beta to a majority-of-engagement driver. Framing shifted from usage growth toward hospital enterprise sales and PeerCheck as the trust moat. |
| AI Search paid monetization (new TAM) | emerged | Q3 2026, Q4 2026 | First flagged in Q3 as strong inbound demand with a product 'this year'; launched commercially in Q4 with first top-20 pharma deals. Management calls it a multibillion-dollar incremental market but has put minimal revenue in the FY27 guide. |
| Policy, MFN and macro budget uncertainty | persisted | Q1 2026, Q2 2026, Q3 2026, Q4 2026 | A recurring overhang that escalated in tone through the year: general policy caution, then Most Favored Nation pricing deals delaying budgets, then broader macro and geopolitical risk. Consistently cited as the reason for limited visibility. |
| Health-system AI-suite adoption | emerged | Q2 2026, Q3 2026, Q4 2026 | New this year and ramping fast: first top-20 hospitals in Q2, over 100 health systems / 180,000 prescribers in Q3, and 140 systems / 250,000 prescribers by Q4, positioned as a distribution moat via HIPAA-compliant, committee-approved access. |
| Outgrowing the market by roughly 2x | dropped | Q1 2026, Q2 2026 | A long-standing claim (growing ~2x the market rate) that was reaffirmed in the first half but effectively set aside by Q3-Q4, where management guided to in-line-with-market growth and only 'maybe slight outperformance' for FY27. A notable step-down in stated ambition. |
| Client portal and integrated AI-optimized programs | persisted | Q1 2026, Q2 2026, Q3 2026, Q4 2026 | Integrated multi-module programs grew from a small share of bookings to a large one and the portal user base kept expanding, but the topic received noticeably less airtime by Q4 as the narrative pivoted to AI Search. |
Guidance ledger
Quotes, calls, and speakers are source-verified; outcomes are curator-classified.
| Verbatim guidance | Call | Speaker | Curator outcome | Outcome note |
|---|---|---|---|---|
| “For the full fiscal year, we now expect revenue in the range of $628 million to $636 million, representing 11% growth at the midpoint.” | Doximity, Inc., Q1 2026 Earnings Call, Aug 07, 2025 · 2025-08-07T21:00:00 | Anna Bryson | kept | Fiscal 2026 finished at $645 million (+13%), above this early-year range, which was raised in subsequent quarters. |
| “For the third fiscal quarter of 2026, we expect revenue in the range of $180 million to $181 million, representing 7% growth at the midpoint” | Doximity, Inc., Q2 2026 Earnings Call, Nov 06, 2025 · 2025-11-06T22:00:00 | Anna Bryson | kept | Q3 revenue came in at $185.1 million (+10%), exceeding the high end of this range. |
| “For the fourth fiscal quarter of 2026, we expect revenue in the range of $143 million to $144 million, representing 4% growth at the midpoint” | Doximity, Inc., Q3 2026 Earnings Call, Feb 05, 2026 · 2026-02-05T22:00:00 | Timothy Cabral | kept | Q4 revenue was $145 million (+5%), above the high end of this range. |
| “Even with these investments, we are in a position where we expect to maintain 50% or greater adjusted EBITDA margins on an annual basis.” | Doximity, Inc., Q3 2026 Earnings Call, Feb 05, 2026 · 2026-02-05T22:00:00 | Timothy Cabral | kept | Fiscal 2026 delivered a 55% annual adjusted-EBITDA margin; note the floor was subsequently lowered to the high-40s for fiscal 2027. |
| “I think we will end the year, exit the year as a double-digit grower.” | Doximity, Inc., Q3 2026 Earnings Call, Feb 05, 2026 · 2026-02-05T22:00:00 | Perry Gold | pending | Refers to exiting calendar 2026; not yet reported. The subsequent FY27 outlook of ~4% growth puts a double-digit exit in some tension. |
| “For the full fiscal year, we expect revenue in the range of $664 million to $676 million, representing 4% growth at the midpoint” | Doximity, Inc., Q4 2026 Earnings Call, May 13, 2026 · 2026-05-13T21:00:00 | Perry Gold | pending | Fiscal 2027 outlook; no later call in the supplied history to judge the outcome. |
| “we remain committed to maintaining adjusted EBITDA margins in the high 40s or better in fiscal 2027” | Doximity, Inc., Q4 2026 Earnings Call, May 13, 2026 · 2026-05-13T21:00:00 | Perry Gold | pending | Fiscal 2027 margin commitment, a step down from the 50%-plus floor cited in prior quarters; not yet testable. |
Q&A pressure map
Question counts and firms are curator tallies; analyst coverage shown above.
| Topic | Questions | Firms | Pressure / response |
|---|---|---|---|
| Pharma budget softness, shorter-duration buys and guidance visibility | 8 | Raymond James & Associates, Barclays, Needham & Company, Canaccord Genuity, RBC Capital Markets, Mizuho Securities, Goldman Sachs, KeyBanc Capital Markets | The dominant line of questioning on the latest call and a persistent theme all year. Analysts probed why demand is soft, why commitments are shorter, and what would unlock budgets. Management pointed to policy and macro uncertainty and framed shorter commitments as coming at higher prices; on a prior call it also declined to quantify the record January bookings growth rate. |
| AI Search monetization: size, ramp timing and competition | 5 | Raymond James & Associates, Barclays, Morgan Stanley, Goldman Sachs | Analysts pushed for a serviceable market size and a monetization timeline. Management conceded it is a genuinely new market that is hard to size and guided to a back-half ramp given med-legal and keyword review, differentiating on drug reference and PeerCheck rather than banner-style ads. |
| FY27 margin compression and AI compute spend | 2 | Leerink Partners, Evercore ISI | Questions on how much AI investment is the right amount and whether the Q4 margin is the go-forward run-rate. Management framed rising compute, PeerCheck and brand-marketing spend as a deliberate trade for engagement growth. |
Language shifts
Only language evidence verified against the referenced component is shown.
| Observation | Verbatim evidence | Call ID | Component |
|---|---|---|---|
| New 'AI investment year' framing that explicitly trades near-term margin for AI spend, a shift from prior quarters' emphasis on protecting 55%-plus margins. | “This is our AI investment year.” | 1997209063 | 2 |
| Geopolitical risk enters the vocabulary; prior FY26 calls centered on policy and MFN uncertainty rather than macro or war. | “We didn't have a war in Iran 90 days ago.” | 1997209063 | 38 |
| Explicit downshift from the long-standing ~2x-market claim to in-line growth with at most slight outperformance. | “This year, if you look at our guide, we are looking like, at least at this point, we'll be more in line with the market, maybe slight outperformance.” | 1997209063 | 51 |
| Continued soft-demand and limited-visibility caution, carried forward from the prior call rather than resolved. | “with short-term demand in the HCP digital pharma ad market soft and visibility is still limited.” | 1997209063 | 3 |
The call history shows a company converting its physician-engagement lead into an AI platform even as its core pharma-ad growth decelerated from the low-20s to single digits. Fiscal 2027 is framed as an investment year that trades margin and near-term growth for an unproven AI-Search monetization ramp, so the central debate is whether that back-half revenue materializes as promised before the premium associated with outgrowing the market can return.
Network and Slowdown
Doximity runs the largest professional network of U.S. physicians and sells access to it, mainly to drug makers and hospitals. It is genuinely profitable and cash-rich: FY2026 revenue of $645 million at an 89% gross margin, $317 million of free cash flow, and $749 million of cash and securities against no debt [1] [2]. Yet the shares, near $22, have fallen about 70% from September 2025 as revenue growth halved to 13% and management guided the next year to 4%.
Doximity's growth reset from 20% to a guided 4% reached its biggest, most committed customers — top-20 net revenue retention fell from 119% to 114% and the over-$500k cohort's growth halved to 6% — so the deceleration is not only in the marginal spend a cyclical rebound would restore. [3] [4] If that slide in the anchor accounts is structural rather than a matter of timing, the guided ~4% for FY2027 — about $670 million at the midpoint, down from roughly 20% two years earlier — is closer to a new base rate than a trough: the discounted-cash-flow work in What the Price Implies puts the ceiling case near $19 a share on reported free cash flow and about $14 on owner cash, at or below today's $21.77, so a durable top-20 decline validates the ceiling column rather than a recovery. The strongest facts on the other side sit in the same window: net revenue retention is still above 100%, so the installed base kept growing; the pricing shock that hit the fourth quarter landed on the same 16 of the top-20 pharmaceutical accounts and disrupted the timing of budgets rather than the demand behind them [5]; and January pharmaceutical bookings were the best Doximity has reported since its 2021 IPO [6].
What Doximity is
Doximity is a cloud platform for U.S. medical professionals. As of March 2026 it had more than 3 million registered members, representing over 85% of U.S. physicians across every specialty, roughly 90% of graduating medical students, and two-thirds of nurse practitioners and physician assistants [7]. Doctors use it free — to message colleagues, read medical news, manage their careers and on-call schedules, run telehealth visits, and, increasingly, to run AI search and clinical documentation tools.
The money comes from the other side of the network. Doximity's paying customers are primarily pharmaceutical manufacturers and health systems, who buy Marketing, Hiring, and Workflow solutions to reach that verified physician audience [8]. About 94% of FY2026 revenue was subscription-based, and marketing to physicians — pharma advertising — is by far the largest line [9]. It is, in effect, a targeted-advertising and hiring marketplace wrapped around a professional network — with the unusual property that the audience is nearly the entire profession.
FY2026 Revenue ($M)
FY2026 Free Cash Flow ($M)
Gross Margin
Cash & Securities, net of debt ($M)
Sources: FY2026 Form 10-K, Item 1 and Liquidity [10] [11]; free cash flow per the Q4 FY2026 earnings call [12].
The economics are unusually clean
Doximity does not look like a typical recently-listed software company. Gross margin has held near 89–90% for years, and the business has been GAAP-profitable throughout its public life [13]. Revenue has grown from $344 million in FY2022 to $645 million in FY2026, while operating cash flow rose from $127 million to $326 million over the same span — the company converts roughly half of revenue to cash [14] [15].
Sources: FY2026 Form 10-K, Consolidated Statements of Operations and Cash Flows [16]; FY2024 Form 10-K for FY2022–FY2023 [17].
That cash has funded aggressive buybacks rather than acquisitions or debt paydown. Doximity completed a $500 million repurchase program and, in FY2026 alone, bought back $432 million of stock — more than its free cash flow — spending steadily as the price fell, including 2.7 million shares in March 2026 at an average of $24.45 [18]. A fresh $500 million authorization was set in February 2026 [19]. The net effect: shares outstanding have fallen even as the company issues heavy stock compensation.
What changed
Three things turned at once in FY2026, and together they reset how the market values the business.
Growth halved. Revenue rose 13% in FY2026, down from 20% in FY2025, and management guided FY2027 revenue of $664–676 million — about 4% growth — citing a soft market for physician-directed pharma advertising and customers signing shorter, smaller commitments [20] [21]. Net revenue retention — subscription revenue from existing customers versus the prior year — fell to 109% from 119% [22].
The bottom line dipped. Net income fell to $196 million from $223 million, even as revenue grew, because stock-based compensation jumped to $122 million from $72 million — pushing operating margin down to 33% from 40% [23]. Management guides stock comp higher still in FY2027, to the low-20s as a percent of revenue [24]. This is the gap between GAAP earnings and cash flow that any buyer of the stock has to weigh.
Concentration rose. For the first time, a single customer accounted for 10% or more of total revenue in FY2026 — a threshold no customer had crossed in FY2025 or FY2024 — and the 125 customers spending at least $500,000 each supply 83% of revenue [25] [26].
Sources: FY2026 Form 10-K, Results of Operations and Key Business Metrics [27] [28].
The bet management is making
Doximity calls FY2027 its "AI investment year." It bought Pathway AI for $63 million in 2025 and is spending heavily against the opportunity: research and development rose to $131 million from $93 million, and the company says higher R&D, compute, and marketing costs will weigh on near-term margins [29] [30]. The product is a clinical AI suite — search and documentation ("Scribe") tools for doctors — which 140 health systems had purchased as of the call, and which management frames as a "multibillion-dollar new TAM" of AI-search advertising layered on top of the roughly $2.5–3 billion digital physician-advertising market it serves today [31] [32].
By management's own guidance, AI contributes minimal revenue in FY2027 [33]. So the near-term picture is a mature core growing slowly while the company funds an option on a larger market — with the cost visible now and the payoff, if any, later.
What the stock has done
Doximity priced its IPO at $26.00 in June 2021, traded above $100 within months, then round-tripped [34]. More relevant is the recent move: the shares had recovered to roughly $73 by September 2025, near their post-IPO highs, before falling to about $22 by mid-2026 — a decline of around 70% in nine months, and near an all-time low — driven by the growth reset described above rather than by the 2021 bubble.
Source: market prices, as reported (quarter-end closes, June 2021 – July 2026); IPO price per the Final Prospectus [35].
At about $22, and roughly 183 million shares outstanding, the market capitalization is near $4.0 billion [36]. Backing out the $749 million of cash and securities leaves an enterprise value near $3.2 billion — roughly 10 times FY2026 free cash flow [37] [38]. That is an inexpensive multiple for a business with 89% gross margins and no debt, which makes the case most sensitive to which reading of the slowdown holds.
The question this report will answer
Doximity is not a broken business; it is a highly profitable one whose growth engine has downshifted from 20% to a guided 4% in two years, while net revenue retention slipped below 110% and customer concentration rose. The question the rest of this report exists to answer: is that deceleration the arrival of a ceiling — a network that has already signed most of the pharmaceutical and health-system budgets it can reach — or a cyclical soft patch in physician-directed advertising that Doximity's near-universal reach and its self-funded pivot to clinical-AI monetization can eventually grow past? Everything that follows — the durability of the moat, the true cash economics net of stock compensation, the pharma-ad cycle, the AI opportunity, and the roughly $3.2 billion enterprise value at about ten times free cash flow — informs that judgment.
The Moat
Doximity's competitive advantage is really two advantages of different widths. Around the audience — more than 85% of U.S. physicians, using its workflow tools daily — the moat is wide and expensive to copy. Around the revenue — a slice of a discretionary, cyclical pharmaceutical marketing budget that Medscape and newer AI-native rivals also chase — it is narrower. The retention slide from 119% to 109% is where the second moat is visibly bending, which is why the slowdown is worth reading carefully rather than dismissing.
of U.S. physicians are members
Registered members (millions)
Quarterly workflow providers (000s)
Source: FY2026 Annual Report (Form 10-K), MD&A — Overview and Key Business Metrics [1]; workflow-provider count [2].
The audience side: near-universal, and still widening
The starting point of any moat claim here is coverage. As of March 31, 2026, Doximity reported over 3 million registered members representing more than 85% of U.S. physicians across all 50 states and every specialty, plus about two-thirds of U.S. nurse practitioners and physician assistants [3]. Four years earlier the network already held more than 80% of physicians and over 90% of graduating medical students, on a base of two million members [4]. Reach that starts above 80% cannot compound the way a young network does; the durable edge is that it kept adding physicians while capturing the students who become the next cohort of prescribers.
Two structural features make the audience hard for a rival to reconstruct. First, membership is credential-verified: each profile functions as a validated digital curriculum vitae tied to training, licenses, affiliations and specialty, and members must be verified before they gain access to the network and productivity tools [5]. Verified identity is what lets a pharmaceutical customer trust that it is reaching a real, targetable prescriber rather than anonymous traffic. Second, Doximity is, on its own account, the only professional network dedicated solely to medical professionals — it competes for members against LinkedIn, Facebook, Google and X, none of which is purpose-built for clinical work [6]. The counter-fact a skeptic should hold: those platforms are vastly larger and better capitalized, and "purpose-built" is a positioning claim, not a legal barrier. What converts it into a barrier is not the network page but the workflow.
Engagement: used, not just registered
A membership roster is only an asset if physicians return to it. Here the evidence is unusually concrete, and it recently became more so. Doximity discloses that quarterly unique active providers using its workflow tools reached 0.81 million in FY2026, up from 0.62 million in FY2025 and 0.58 million in FY2024 [7]. On the earnings calls the same story is louder: a record 590,000 unique active prescribers used its generative-AI, telehealth, messaging and scheduling tools in a single quarter of FY2025, with daily active users growing the fastest of any cadence — the sign that the app has moved into day-to-day clinical routine rather than occasional reference [8].
Source: FY2026 Annual Report (Form 10-K), Key Business Metrics — figures presented in millions, shown here in thousands [9].
This metric deserves a caveat that also strengthens it. Doximity historically featured engagement figures on its calls without defining them in its filings; a March 2026 SEC comment letter pressed the company to define, quantify and analyze those metrics in MD&A, and Doximity agreed to do so beginning with the FY2026 10-K, drafting a figure of 634,000 quarterly workflow providers for March 2025 [10]. The now-published definition counts a provider who, in a quarter, places a call lasting more than ten seconds, sends a fax or secure message, submits a prompt to its clinical-AI tool, or uses its scheduling or ambient-notes tools [11]. The bar for "active" is therefore low, and the number is management's own until an auditor tests it — but the metric is now a defined, filed disclosure rather than a call talking point, and it spans EHR-integrated tools that a competitor cannot easily insert into a physician's existing workflow. Embedded scheduling, dialer and documentation tools are the switching cost: they raise the effort of leaving, which is what a verified-identity network alone does not.
Monetization: land-and-expand, and where it bends
The audience is monetized through expansion inside a concentrated set of large customers. Big pharmaceutical customers typically start with a handful of brands and then add modules and roll the platform across their portfolio once they see quantifiable returns; health systems follow the same path across service lines [12]. That mechanism shows up in the numbers: the count of customers spending at least $500,000 rose from 100 (FY2024) to 118 (FY2025) to 125 (FY2026), and that cohort alone accounted for roughly 83% of revenue in FY2026 [13]. How that expansion has moved quarter by quarter inside the largest accounts, and where it turned down, is taken up in The Upfront Shock.
Net revenue retention measures subscription revenue from the same customers year over year, capturing renewals, expansion, contraction and churn in one figure, and it is where the strain appears. It ran 114% in FY2024, rose to 119% in FY2025, then fell to 109% in FY2026 [14]. A reading of 109% still means the existing base grew — customers are not leaving in numbers — but the rate of net expansion has roughly halved from its peak. Because the company itself notes the metric is directly tied to its revenue growth rate, the retention slide and the growth slowdown are the same event measured two ways, not two separate warnings.
Source: FY2026 Annual Report (Form 10-K), Key Business Metrics — Net Revenue Retention Rate [15].
The competitive front
Doximity's own filing draws the competitive map by budget rather than by product. For marketing dollars it competes with established health-media outlets such as WebMD's Medscape and with newer entrants like OpenEvidence, an AI-native clinical-reference product [16]. The indexed pure-play peer, OptimizeRx, competes for the same pharmaceutical-advertiser spend but through a different channel — point-of-care messaging inside EHR and e-prescribing systems rather than an owned physician network [17]. That difference in model is the clearest evidence for the moat: on comparable latest fiscal years, Doximity earns roughly six times OptimizeRx's revenue at a net margin about six times as wide (30% versus 5%).
Sources: Doximity FY2026 revenue and net income per the FY2026 10-K MD&A [18]; OptimizeRx figures per its reported FY2025 financials [19].
The scale gap is real, but it is not the same as immunity. Two competitive facts cut against the moat. Medscape reaches physicians through content without needing to own their workflow, which shows that a marketing budget can be captured by a large audience Doximity does not control. And OpenEvidence's presence in the filing is the more important tell: an AI-native clinical-reference tool competes for exactly the physician attention and the "innovation" budgets Doximity is now targeting with its own clinical AI. A well-funded rival can copy a content channel or an AI reference tool far faster than it can rebuild a verified, workflow-embedded network — but it does not need to rebuild the network to take the advertising dollar.
Cyclical or structural
The retention slide has two readings, and management's own framing points to the cyclical one. On the Q4 FY2026 call, the company attributed soft demand to the HCP digital pharmaceutical-ad market broadly — elevated policy uncertainty and macro risk — and guided to overall market growth "at or below 5%," with brands making upfront commitments but on shorter planning horizons [20]. Three facts support reading the slowdown as demand-side rather than share loss: 65% of subscription-revenue guidance was booked at the start of the year, in line with the three-year average; engagement was described as at record levels; and revenue and engagement were each up more than 50% versus three years earlier [21]. A network losing its grip does not usually post record usage while its booking pace holds steady.
The structural reading is not thereby retired. If pharmaceutical marketing budgets are simply doing more with less, and if AI-native tools let advertisers reach physicians without paying for Doximity's owned audience, then a cyclical soft patch can harden into a lower plateau. The evidence in this chapter lands on a measured split. The moat around the audience — verified identity, near-universal reach, embedded daily workflow — reads as wide and durable; nothing here suggests physicians are leaving. The moat around the revenue is narrower: it is a share of a discretionary budget, and a 109% retention rate shows that share expanding more slowly than the network's engagement would imply. The split is most sensitive to whether Doximity's own clinical-AI products convert that record engagement back into expanding customer spend faster than AI-native rivals convert it into an alternative advertising channel, a question the AI monetization and recent-results chapters can weigh against the numbers.
The Upfront Shock
Doximity did not glide into its slowdown. Fiscal 2026 ran hot for two quarters — revenue up 15% then 23%, with the full-year guide raised twice — and then broke in the back half, printing 10% and 5% growth. The break has a datable cause: a wave of drug-pricing agreements that landed on Doximity's largest pharmaceutical customers at the exact week they set annual budgets. The FY2027 selling season will show whether that is a timing shock or the onset of a lower run-rate.
A hot first half, a cold second half
Through September, Doximity looked like it was reaccelerating. First-quarter revenue was $145.9 million, up 15% and above the top of guidance; net revenue retention held at 118% [1]. Management raised the full-year outlook to $628–636 million (11% growth) and told investors it had "not yet seen any slowdown in our business" [2]. The second quarter was stronger still: $168.5 million, up 23% and a 7% beat, prompting a second guidance raise to $640–646 million (13% growth) [3].
The 23% print flattered the trend. Doximity's newer multi-module "integrated" programs — which start in January and let clients add spend evenly through the year — reached over 40% of second-quarter bookings, against less than 5% a year earlier, pulling upsell dollars forward that would historically have landed later. Management said as much, warning it did "not expect as large of a step-up between Q2 and Q3 as we've seen in prior years" [4]. The cleaner read is the annual one: calendar-2025 growth of roughly 15%, about twice the digital-advertising market.
Then the second half arrived. Third-quarter revenue grew 10% to $185.1 million [5]; the fourth quarter grew 5% to $145.4 million, closing the year at $645 million, up 13% [6]. A business that had beaten and raised its way through the summer was guiding to low-single-digit growth by winter.
Source: quarterly revenue as reported, Q1–Q4 FY2026 earnings calls [7], [8], [9], [10]; prior-year quarters derived from reported financials.
Fiscal 2025 stayed inside a 17–25% band all four quarters. Fiscal 2026 held that band through Q2, then fell to a level the company had not seen as a public entity. The question is what happened between the two.
What broke in the upfront
Doximity's growth is set once a year, in the "upfront" — the fourth-calendar-quarter selling season when pharmaceutical brands commit annual budgets, most of them signed by December 31. That is the window that failed.
Between late December and early January, 16 of Doximity's top 20 pharmaceutical customers signed "most favored nation" pricing agreements with the White House covering tariffs and drug pricing [11]. Arriving at the worst possible moment, the uncertainty hit the upfront two ways: customers deployed a lower share of their annual budgets upfront, leaving funds unreleased, and deals that would normally have closed by year-end slipped into Doximity's fiscal fourth quarter [12]. Management cut the fourth-quarter guide to $143–144 million, 4% growth, and said calendar 2026 was "off to a slower start than usual" [13].
The same disclosure carries a number that cuts the other way. If demand had been destroyed, the pushed deals would have vanished; instead they reappeared. Doximity's January pharmaceutical bookings growth was, in management's words, "the best we've seen since going public" [14]. The upfront was disrupted in timing, not erased in demand — a distinction that weighs toward the cyclical reading of the slowdown, provided the delayed dollars are actually spent later in the year rather than cancelled.
Deals that missed the December upfront deadline did not disappear: January pharmaceutical bookings growth was the fastest since Doximity's 2021 IPO. The delay, not the demand, is what the fourth-quarter guide reflects.
Retention tells the other side
The bookings tell is real, but so is a slower signal underneath it. Doximity's growth reset from 20% to a guided 4% reached its biggest, most committed customers — top-20 net revenue retention fell from 119% to 114% and the over-$500k cohort's growth halved to 6% — so the deceleration is not only in the marginal spend a cyclical rebound would restore. Net revenue retention — the rate at which existing customers grow their spend — fell every quarter of fiscal 2026: total retention slid from 118% to 109%, and the $500,000-plus customer count, roughly 83% of revenue, actually ticked down between Q3 and Q4.
Source: trailing-twelve-month net revenue retention and customer counts, Q1–Q4 FY2026 earnings calls [15], [16], [17], [18]; top-20 rate not disclosed in Q2.
Retention above 100% still means the installed base expanded; a 109% rate is not contraction. But the direction is the point. A cyclical air-pocket in a single upfront should leave the biggest, most committed clients intact and show up mostly in discretionary marginal spend. That the top-20 rate also fell nine points from its peak — resolving a question earlier chapters left open — says the pressure reached the accounts that anchor the business, and is harder to wave off as one bad December.
The fiscal 2027 test
Management's own framing turns the near-term tape into a falsifiable test. The FY2027 guide is $664–676 million, 4% growth, against a digital-advertising market it now expects to grow "at or below 5%" — the first year in memory Doximity guides to roughly the market rate rather than twice it. Entering the year it had 65% of its subscription-revenue guidance booked, in line with its three-year average, but "with more moderate growth" embedded [19]. Asked directly how it would reassure investors that pharma is not simply learning to do more with less, management conceded this year would be "in line with the market, maybe slight outperformance" [20].
Two dynamics decide whether that 4% is a floor or a trough. The first is behavioral: several top-20 clients have moved from annual commitments to three- and six-month buys, which cuts Doximity's visibility even as it lets the company charge higher prices for shorter commitments [21]. If the shift is a durable response to policy noise, the guided-in caution persists; if it is the noise itself passing, the annual commitments return. The "do more with less" worry management was pressed on is the structural version of this same question [22].
The second is the unbooked 35%, which rests on two sources of back-half spend. Management expects the budgets held back during the disrupted upfront to be released later in the year, and it has, for the first time, a commercial product to sell against them: AI Search, launched in late April, with the first few deals already closed with top-20 pharma manufacturers, though it carries minimal FY2027 revenue and ramps only in the fiscal back half [23], [24]. Management's stated benchmark, repeated across two calls, is to "exit the calendar year as a double-digit grower once again" [25].
That benchmark is a datable test. If the fiscal back half — the October-to-March quarters, where the delayed budgets and the AI-Search ramp both land — returns to double-digit growth, the upfront break was a timing shock and the 4% guide was conservatism about the release of held-back dollars. If those quarters instead settle near the guided rate, the shorter commitments and the softer retention are the run-rate, and 4% is closer to what a near-universal network can extract from a pharmaceutical budget that is no longer expanding. The bookings evidence points to the first; the retention trend keeps the second live. On current evidence the timing explanation is better supported, but it is conditional on money the company has not yet collected, and the CY2026 upsell season is where it is confirmed or denied.
The AI Pivot
Doximity's AI push is, so far, a cost the income statement already carries and a revenue line the disclosures do not yet show. Research spend jumped 40% to $131 million in fiscal 2026 — a fifth of revenue — and the fiscal 2027 guide sets adjusted EBITDA below the prior year in absolute dollars even as revenue grows. The clinical AI tools physicians use are free by design; the money is meant to come later, from a just-launched advertising product, in a market where an AI-native rival is compounding faster.
The cost is already in the numbers
For three years Doximity's research-and-development line drifted down as a share of revenue — from 19.1% in fiscal 2023 to 16.3% in fiscal 2025 — the picture of a business getting more efficient as it scaled. Fiscal 2026 reversed that in one step: R and D rose 40% to $130.7 million, or 20.3% of revenue [1], while revenue grew 13%. Management labelled fiscal 2026 "our year of AI investments," pointing to spending on functionality, content licensing, and compute usage [2].
R and D Expense (FY2026, $M)
R and D Growth YoY
R and D % of Revenue
FY2027E EBITDA Margin
Source: FY2026 Annual Report (Form 10-K), Management's Discussion and Analysis [3]; FY2027 adjusted-EBITDA-margin guidance from the Q4 FY2026 call [4].
Source: derived from reported financials, FY2022–FY2026 10-Ks; FY2026 figures per the Consolidated Statements of Operations [5].
The pressure shows up faster in the cash-earnings line the company steers by. Adjusted EBITDA margin held at 55% for the full year, but the fourth quarter tells the trajectory: 45%, down from 50% a year earlier, with management naming "increased investment in AI compute driven by a steep ramp in AI usage which is outgrowing overall workflow engagement" as the driver [6]. The fiscal 2027 guide carries that forward for a full year: adjusted EBITDA of $323–335 million at a 49% margin [7]. At the midpoint that is roughly $329 million against $358 million in fiscal 2026 — cash earnings falling about 8% while revenue rises 4%.
Source: Q4 FY2026 earnings call — FY2025/FY2026 actuals and FY2027 guidance [8]. FY2027 is the guidance midpoint.
Stock-based compensation runs the same way: about 18.9% of revenue in fiscal 2026, guided to the "low 20s" as a percent of revenue in fiscal 2027 before trending back down, driven by the Pathway acquisition and performance grants for the growing AI team [9]. The buyback more than offsets the dilution (Network and Slowdown), but the AI build widens the gap between reported and cash earnings before it narrows it.
Two different bets under one label
"AI" at Doximity is two initiatives with opposite economics, and they have to be underwritten separately.
Source: FY2026 10-K and Q1–Q4 FY2026 earnings calls, per the citations below.
The clinical suite is a defensive spend, not a product line. Doximity GPT (which composes letters), Scribe (physician-controlled ambient notes), and Pathway's Corpus (a fact-checked clinical and drug reference) are bundled into one free assistant [10]. Pathway Medical, acquired July 29, 2025, was a six-person Montreal startup whose model scored 96% on the U.S. medical licensing exam; Doximity is dropping the roughly $300-a-year subscription Pathway charged and giving the tool away inside Doximity GPT [11]. The purchase was small: $36.3 million of consideration including $26.7 million of cash, plus $23.9 million of restricted stock vesting over five years [12] — a rounding error against $749 million of cash and securities. The point of the free suite is engagement: 300,000 physicians used the AI tools in the first full quarter after the deal [13], and 20% of health systems were using Doximity's AI within a quarter of launch [14]. Management's own framing is that the tools deepen the moat rather than earn a margin — with clinical AI still "in its nascent stages," more than half of 1,800 surveyed physicians had used no clinical AI at all [15].
The revenue case rests on the second bet: commercial AI Search. Launched in the fourth quarter of fiscal 2026, it is described as "already generating strong early interest" [16]. It reaches for an advertising budget Doximity has not sold into before — paid search. Management cites an eMarketer figure that 55% of healthcare digital-marketing spend goes to search [17], and frames the product as a way to "tap into innovation upsell budgets and search budgets" [18]. The company likens the moment to the early days of HCP programmatic advertising three years ago and guides to exiting the calendar year as a double-digit grower once search budgets and delayed pharma funds are released [19].
That is the honest boundary of what can be underwritten today. The suite that physicians touch is free and not sold; the product meant to pay for the whole pivot is one quarter old with no disclosed revenue, and the clinical-reference asset behind it — Pathway — is explicitly not being monetized yet: "we are not trying to actively sell or monetize in the marketplace yet," management said, adding that $91 million of quarterly operating cash flow lets it "invest for the longer term" [20]. The TAM is real and adjacent; the revenue is a plan with early interest attached.
The rival that sets the bar
The reason the clinical suite is defensive is visible in Doximity's own filings: the fiscal 2026 10-K lists OpenEvidence — a company barely three years old — alongside WebMD's Medscape as a competitor for its Marketing Solutions customers [21]. OpenEvidence is the fastest-adopting clinical-AI tool among U.S. physicians, and by public reporting it raised capital in January 2026 at a $12 billion valuation — up from about $1 billion a year earlier and $3.5 billion in mid-2025 — with roughly 45% of U.S. physicians using it and about 18 million clinical consultations in a single month, several times its volume a year before. Those figures come from funding announcements and press, not company filings, and cannot be reconciled to a source document here; they are directional press estimates rather than precise counts.
The two companies are also in court. On June 20, 2025, OpenEvidence sued Doximity, its chief technology officer, and its director of AI products in the U.S. District Court for Massachusetts, alleging unauthorized access to its AI platform; Doximity filed counterclaims in September 2025 for false advertising and defamation, and the plaintiff amended its complaint in October 2025 to add Pathway Medical and computer-fraud claims [22]. The litigation matters less for its damages exposure than for what it signals: the two are fighting over the same physician attention in clinical reference, and Doximity is the incumbent defending, not the challenger.
This rivalry is where the structural risk to the network sits. Doximity's read — stated repeatedly — is that in clinical AI "the tech here is increasingly a commodity" and that trust, relationships, and the platform decide who wins, an argument its 85%-plus verified network is built to make (The Moat) [23]. The counter-case is that a well-funded, AI-native product is winning physician usage in exactly the reference workflow Doximity is entering with a free tool — and that giving Pathway away is itself evidence the company cannot charge for clinical AI while OpenEvidence is free and ahead. Which of those holds is not yet in the numbers.
What would turn cost into revenue
The pivot is falsifiable, and the lines that would confirm or deny it are named. My read: the AI build is a rational, self-funded defense of the network today, and a credible but unproven growth bet for tomorrow — worth carrying because Doximity can afford it, not yet worth crediting as revenue. What would move that read, in order of decision value:
Re-acceleration to a double-digit exit rate. Management guides to exiting the calendar year growing at double digits from a 4% start, explicitly crediting commercial AI Search and released search budgets. Subscription revenue growth reaccelerating through fiscal 2027 is the most direct read on whether AI Search is converting; a flat or decelerating back half would say it is not.
The adjusted EBITDA margin path. The 49% fiscal 2027 guide is framed as a peak-investment trough, with stock comp and compute costs trending down from fiscal 2028. Margin recovering on plan would confirm the spend was a discrete build; margin staying at or below 49% would suggest AI compute is a permanent cost of competing, not a one-year investment.
Disclosed AI Search economics. The company has said it will not talk much about its search plans, to avoid tipping competitors. The first quarter it quantifies AI Search revenue, attach rates, or a defined engagement metric for it — as the SEC recently forced it to define its workflow metric (The Moat) — is the point the plan becomes underwritable rather than asserted.
Sources: Q3 FY2026 call — double-digit-exit and search-budget commentary [24]; Q4 FY2026 call — margin and stock-comp trajectory [25].
The market has already taken a side on the near term: the shares fell roughly a quarter on the fiscal 2027 guide, reading the combination of a 4% top line and a stepped-up AI bill as reason to worry rather than to wait. That reaction is about timing. Whether the pivot works is about the three lines above — and none of them will resolve before the fiscal 2027 back half.
Doximity converts a large share of revenue into cash and carries no debt, and its diluted share count has fallen even as stock compensation doubled. But the two facts sit in tension. Stock-based compensation reached $121.6M in FY2026 — a real cost that free cash flow adds back — and the flagship $500M repurchase program retired 11.6M shares at an average near $43 while the stock now trades close to $22. The cash is real; the largest tranche of buyback was expensive.
The cash engine
The business throws off a lot of cash. In FY2026 Doximity generated $326.5M of operating cash flow on $644.9M of revenue, spent almost nothing on property, and ended the year with $748.6M of cash and marketable securities and no debt [1] [2]. Operating cash flow ran at 1.7x net income of $196.1M [3] — the kind of conversion that ordinarily signals high earnings quality.
Revenue (FY2026, $M)
Operating cash flow ($M)
Stock-based comp ($M)
Cash flow after SBC ($M)
Source: FY2026 Annual Report (Form 10-K), Consolidated Statements of Cash Flows and Results of Operations [4] [5]; cash flow after SBC ($326.5M − $121.6M) is a calculation.
Where the gap between cash and earnings comes from
Most of the distance between $326.5M of operating cash flow and $196.1M of net income is a single add-back: stock-based compensation of $121.6M [6]. Cash flow treats it as non-cash and adds it back; a shareholder cannot, because the shares issued to employees are a claim on the same equity. Netting it out, the cash the business produces for owners was closer to $205M — about 32% of revenue rather than the ~51% an operating-cash-flow margin implies.
The cost is also rising, and rising fastest in the part of the business the report has already flagged as the reinvestment engine. Total SBC climbed from $51.1M in FY2024 to $72.4M in FY2025 to $121.6M in FY2026 — from 10.7% of revenue to 18.9%. Within that, research-and-development stock comp nearly quadrupled over two years, from $12.0M to $46.2M, as Doximity granted equity to build out the AI Pivot team [7].
Source: FY2026 Annual Report (Form 10-K), Results of Operations — stock-based compensation by function [8]. "Rest" = total SBC less the R&D component.
That is not, by itself, a mark against the company — paying an AI team in equity is a defensible way to fund the build without touching the cash pile. But it changes how the cash story should be read: the reported cash margin flatters the underlying economics by roughly 13 points, and the flattering item is growing.
The buyback record
Doximity pays no dividend; its entire return of capital runs through repurchases, and it has been active. Since FY2022 it has spent roughly $921M of cash retiring stock [9], across four authorizations. The prices it paid, program by program, are what determine whether that spending created value.
Sources: FY2024 10-K (programs through April 2024) [10]; Q2 FY2025 10-Q (16,480,514 shares completed by April 2024) [11]; FY2026 10-K (May 2024 and February 2026 programs) [12]. Average prices are calculated as dollars authorized/spent divided by shares retired.
The first $410M — spent across programs completed by April 2024 — retired 16.48M shares at an average near $25 [13] [14]. Against a stock near $22 today, that early buying looks roughly break-even.
The $500M program authorized in May 2024 is the largest of the four. Doximity retired 11.59M shares under it and completed it by March 31, 2026 — an average of about $43 per share [15]. Most of that half-billion was deployed through calendar 2025, when the stock spent the year between roughly $50 and $70 before falling sharply into early 2026. On February 3, 2026, after the drawdown, the board authorized a fourth $500M program; by March 31 it had bought just 321,080 shares for $7.5M — about $23 each — leaving $492.5M unspent [16].
What the buyback bought
Two readings are both true, and they pull in opposite directions.
On the supportive side, the buyback has done its arithmetic job: it has held the share count down against heavy dilution. Diluted weighted shares peaked at 213.4M in FY2023 and fell to 199.0M in FY2026, a 6.7% reduction, even as stock comp doubled; actual shares outstanding at year-end were 183.1M [17]. The company funded all of it from cash generation without touching its $748.6M balance-sheet cushion or issuing debt [18]. In units, per-share value is being concentrated, not diluted away.
Source: FY2026 Annual Report (Form 10-K), Consolidated Statements of Operations (weighted-average diluted shares) [19]. FY2021–FY2022 reflect the June 2021 IPO.
On the critical side, price paid decides whether reducing the count actually created value, and the biggest program paid up. The 11.59M shares bought at ~$43 are worth about $252M at a $22 quote — roughly $250M below cost on a mark-to-market basis. Put differently, had that $500M been spent at today's price it would have retired about 23M shares rather than 11.6M; the timing cost the company on the order of 11M shares of potential retirement, close to 6% of the share base. The pattern is the uncomfortable part: repurchase spending peaked in FY2026 at $432M, the same window in which the stock was most expensive [20], and the fresh, cheaper authorization has barely been used.
Two caveats keep this from being a verdict. A buyback is properly judged against intrinsic value, not the current tape — if $22 understates the business more than $43 overstated it, the flagship program looks less like an error and more like an unlucky entry point. And the decisions belong to a control structure worth naming: Class B holders, led by the founders and executives, command about 79% of the voting power, so capital-allocation calls are effectively insider calls rather than the board's to be pressured on [21]. What would change the read is observable: whether the $492.5M still authorized is deployed near current prices and the count falls materially in FY2027, or whether it sits idle while the average cost stays anchored at $43.
The cash generation underneath all of this is genuine, and it is what lets Doximity self-fund the reinvestment year the rest of the report describes. The question this chapter leaves is narrower than the thesis but adjacent to it: a company that buys back its most expensive shares and slows as they cheapen is returning cash without reliably creating per-share value — and, so far, has left most of the cheaper authorization unspent.
What the Price Implies
At $21.77, Doximity carries a market capitalization near $4.0 billion and an enterprise value near $3.2 billion against roughly $317 million of free cash flow [1] — about ten times, down from roughly 40 times at the September 2025 peak, a 70% drawdown that is almost entirely multiple compression, since free cash flow rose 19% over the same window the shares fell [2]. The reflex read is that ten times free cash flow is cheap. Whether it is turns on a single line in the cash-flow reconciliation. The $122 million of stock compensation that lifts Doximity's free cash flow to $317 million above its $196 million of net income is also what decides its valuation: on reported free cash flow it trades at ~10x, but net that compensation out and owner cash is ~$205 million — ~16x, whose steady-growth DCF is ~$21, essentially today's $21.77 price. [3] [4]
Reported free cash flow of $317 million adds back nearly $122 million of stock-based compensation. That add-back is not a bookkeeping line the cash statement is right to erase; it is a real transfer of ownership to employees that a shareholder cannot add back. Net of it, owner cash is closer to $205 million, the enterprise trades at about sixteen times that figure rather than ten, and even the steady-growth case lands near today's price rather than well above it.
The counter runs the other way, and it is not weak. The step-up in stock compensation toward the low-20s percent of revenue is guided as a discrete Pathway and AI-grant event that reverses, trending back down from FY2028; and reported free cash flow is cash the company actually collected, not an accrual — it funded $432 million of share repurchases in FY2026.
Which cash figure you capitalize is the assumption the valuation is most sensitive to, alongside the terminal growth rate. On reported free cash flow and a 3% terminal rate the steady case is worth about $31 a share; holding growth fixed and moving the discount rate from 9% to 12% ranges it from about $35 down to $25; swapping the base to SBC-adjusted owner cash brings it to about $21. The gap between "clearly cheap" and "roughly fair" is largely that single accounting choice, which is why this chapter reports both cash bases below.
The multiples
The balance sheet does most of the work in setting the frame. Doximity ended FY2026 with $748.6 million of cash, cash equivalents and marketable securities and no debt [5], so enterprise value is the market cap less roughly $0.7 billion of net cash. On 131,975,436 Class A and 50,896,611 Class B shares outstanding as of May 12, 2026 [6], the equity is worth about $4.0 billion and the enterprise about $3.2 billion.
Market Cap
Enterprise Value
Net Cash (no debt)
EV / FCF (x)
EV / Adj. EBITDA, FY27E (x)
FCF Yield
Sources: cash and marketable securities, FY2026 10-K, Liquidity and Capital Resources [7]; share count, 10-K cover [8]; free cash flow and adjusted EBITDA, Q4 FY2026 earnings call [9]; price per NYSE market data.
These are value-stock multiples on a business that still looks like a software company underneath: 91% non-GAAP gross margins, a 55% adjusted EBITDA margin, and free cash flow at 49% of revenue in FY2026 [10]. On trailing GAAP net income of $196.1 million [11], the price-to-earnings ratio is about 20 times; on consensus FY2027 adjusted earnings near $1.43 a share, it is about 15 times. The tension in the whole chapter sits in that pairing — high-quality margins, low-growth multiples.
A growth multiple that became a value multiple
Doximity did not get cheap because the business broke. It got cheap because the market stopped paying a growth multiple for it. The stock traded at $73.15 as recently as September 30, 2025 — the date the 10-K uses to mark $9.86 billion of non-affiliate equity value [12]. At that price the enterprise was worth roughly $12.6 billion, or about 40 times the same $317 million of free cash flow that today supports a $3.2 billion enterprise value.
Source: NYSE daily closing prices; the September 30, 2025 close of $73.15 is the reference price on the FY2026 10-K cover [13].
The distinction matters for how to read the drawdown. A 70% fall driven by collapsing cash flow is a different investment than a 70% fall driven by a re-rating of unchanged cash flow — and this is the second kind. Free cash flow set a record in FY2026, engagement set records, and the shares still lost two-thirds of their value [14]. What changed was the growth rate the multiple was being applied to.
What the Street now models
The reset in the multiple tracks a reset in the forward numbers. Management's FY2027 guide is for revenue of $664 million to $676 million — 4% growth at the midpoint — with adjusted EBITDA of $323 million to $335 million, a 49% margin versus 55% in FY2026 [15]. That is the "AI investment year": revenue growth roughly flat with the overall HCP digital-ad market, which management expects to grow "at or below 5%," and profit dollars stepping down as AI compute, marketing and stock-based compensation rise [16].
Sources: FY2025–FY2026 actuals and FY2027 guidance midpoints, Q4 FY2026 earnings call [17]; FY2028 figures are consensus estimates, as reported.
Consensus adds almost nothing to that picture. The sell-side models FY2027 revenue near $672 million and adjusted EBITDA near $331 million — effectively the company's own guide — then a partial FY2028 recovery to roughly $712 million of revenue and $355 million of EBITDA. That shape is a trough followed by a modest bounce, not a re-acceleration: the Street is not underwriting AI Search as a new growth engine, it is waiting to see the current one stabilize. The direction of travel has been down. Consensus FY2027 adjusted earnings have been cut from about $1.63 ninety days ago to $1.43, and in the most recent week every one of the 19 covering analysts lowered the number. The price-target range runs from $18 to $42, with a $24.50 mean and a $24.00 median; the stock trades below both.
What $21.77 implies
Because the balance sheet holds net cash and capital intensity is negligible, the valuation reduces cleanly to a stream of free cash flow plus $0.7 billion of cash. A transparent discounted-cash-flow frame — a 10% discount rate, five years of explicit growth, then a terminal rate — brackets what the price is discounting. The three paths below are a map of the debate this report has built, not probabilities.
Source: derived from FY2026 reported free cash flow of $317 million [18] and SBC-adjusted owner cash of roughly $205 million (Cash and Buybacks); discount rate and growth assumptions in the note below.
On reported free cash flow, the flat-growth "ceiling" case is worth about $19 a share, the steady case about $31, and a genuine AI-driven re-acceleration about $45. Those three numbers sit almost exactly on the analyst target spread — the $18 low, the low-$30s that a return to durable growth would justify, and the $42 high. The current $21.77 sits between the ceiling and steady cases, nearer the ceiling: the price is discounting roughly the no-growth outcome, with the recovery and the AI upside treated as optionality rather than base case.
The balanced read
My read is that the de-rating has done its work rationally rather than overshooting. At about 10 times reported free cash flow — or roughly 16 times owner cash — for a business guided to 4% growth, with net revenue retention down to 109% and a first customer past 10% of revenue, the multiple looks closer to fair than to a bargain. A durable-but-slow-growing network monetized inside cyclical pharma budgets is worth a low-teens-to-mid-teens multiple of owner earnings, and that is roughly where it trades.
The strongest fact against that read is the quality of what got repriced. Doximity generated record free cash flow, grew it 19%, and set engagement records in the same year the multiple collapsed [19]; if commercial AI Search converts even a fraction of its claimed multibillion-dollar TAM to revenue, the steady and re-acceleration cases ($31 to $45 on reported cash) are not in the price at all. At $21.77 the option on that outcome is close to free, which is a different thing from expensive.
What would move the read is observable. Subscription growth re-accelerating toward a double-digit exit rate, or the first disclosed AI Search revenue, would pull the base case from ceiling toward steady and re-rate the multiple upward. Continued erosion — net revenue retention sliding further below 109%, owner cash falling as compute costs outrun monetization, or the 10%-plus customer renegotiating — would validate the ceiling case and make even 10 times reported free cash flow look full. The company keeps 65% of its subscription guidance booked entering the year [20], so the FY2027 prints will resolve which case is running well before the AI revenue does.
Founder Control
Doximity is a controlled company in the fullest sense. Co-founder and CEO Jeff Tangney holds 76.3% of the voting power on 28.9% of the economics; directors and officers as a group hold 80.3% of the vote on 31.3% of the shares [1]. The dual-class structure runs to 2031 [2]. Every capital-allocation call the report has weighed was, in voting terms, an insider decision with no external check.
The wedge between votes and economics
Class B shares carry ten votes; Class A shares carry one [3]. At March 31, 2026, 50.9 million Class B shares sat against 132.2 million Class A shares [3], so the roughly 28% of the company held in Class B commands about 79% of the vote [4]. Nearly all of that Class B is Tangney's: he owns 52.9 million Class B shares, 94.6% of the class [5].
Tangney Voting Power
Tangney Economic Stake
Insiders as a Group (Votes)
Control Sunset (Year)
Sources: 2025 proxy, beneficial-ownership table [6]; FY2026 10-K, Risk Factors [7].
The two bars below quantify that wedge. A holder with a minority of the economics decides every matter put to shareholders — the election of directors, amendments to the charter, and any merger or sale of the company [8]. Outside holders own roughly 69% of the company and cast under 20% of the vote.
Source: 2025 proxy, beneficial-ownership table; "Other holders" derived as the residual [9].
The control does not expire on its own for years. The certificate sunsets the super-voting rights ten years after the June 25, 2021 IPO prospectus — mid-2031 — and only sooner if Class B holders sell enough shares to fall below a majority of the vote [10]. Because transfers convert Class B to Class A, a founder who holds his shares only concentrates his relative voting power over time.
A structure built to keep control
Voting control is reinforced by the standard anti-takeover apparatus. The board is divided into three staggered classes, so only one class stands each year and a majority cannot be replaced in a single meeting [11]. Amendments to key charter and bylaw provisions require a 66 2/3% supermajority, and once Class B falls below a voting majority, shareholders lose the right to act by written consent [12].
The board itself is largely independent — five of six directors qualify — but the one who is not independent, Tangney, also chairs it. There is no independent chair and no lead independent director disclosed [13]. The same person who controls the vote sets the board's agenda. Independence on paper coexists with a chair who cannot be voted off by outside holders.
Pay, alignment, and the founder carve-outs
CEO compensation for FY2025 was $17.2 million, about 75 times the $229,000 median employee [14]. The figure is lumpy — Tangney's total was $298,869 in FY2024 — because FY2025 carried a $15.4 million equity grant that vests over several years [15]. In the same year the compensation committee doubled his base salary from $300,000 to $600,000, retroactive to the start of the fiscal year [16].
CEO Pay FY2025 ($M)
CEO : Median Pay (x:1)
CEO Pay FY2024 ($)
Source: 2025 proxy, Summary Compensation Table and CEO Pay Ratio [17] [18].
The counterweight to the pay is exposure. Tangney's roughly 55 million shares are worth close to $1.2 billion at the mid-2026 price, and that stake fell with the stock — the controlling holder absorbed more of the drawdown in dollar terms than any outside investor. His incentives are aligned to the share price even where no outside vote constrains him. That alignment is the strongest argument that the capital-allocation record the report has already weighed (Cash and Buybacks) — buying back stock into the 2025 peak — was an honest misjudgment of value rather than value extraction.
Two carve-outs cut the other way. The insider-trading policy bars pledging shares as loan collateral for everyone, but in November 2023 the audit committee granted Tangney a one-time exception to pledge Class A shares (under 5% of his equity) for a personal loan; it was unwound in May 2025 [19]. And the annual say-on-pay vote — advisory and non-binding — drew 98.6% support [20]; with insiders casting 80% of the vote, the endorsement is largely self-ratified.
Insider trading has been one-directional through the drawdown. Across the last two years there were no open-market purchases by insiders; directors and the then-CFO sold about $9.8 million, most of it in calendar 2025 near the highs, under pre-arranged 10b5-1 plans. Tangney was not among the open-market sellers.
Source: SEC Form 4 filings, as reported; no open-market insider purchases over the period.
Management continuity has also thinned at the top. Co-founder Nate Gross stepped down as Chief Strategy Officer in June 2025, remaining an advisor [21], and the CFO seat has since passed to an interim principal financial officer. The founder-CEO's control is now less diluted by a second founder in the executive ranks.
Litigation over the engagement disclosures
The engagement figures that underpin the network thesis are contested in court. A securities class action covers investors from the June 2021 IPO to August 2023 and names the company and its CEO over disclosures of user count and engagement rates; six shareholder derivative suits allege breach of fiduciary duty and related claims against directors and officers on the same facts [22].
Watch item: the same engagement metric the SEC pressed Doximity to define in a March 2026 comment letter (The Moat) is the subject of the securities and derivative litigation covering June 2021 to August 2023. That same engagement metric underpins the "network is used, not just registered" case, and it is now being tested in discovery.
The derivative suits matter more for governance than for the balance sheet. Delaware indemnification and the company's charter shield directors from monetary damages for most fiduciary breaches, and directors-and-officers insurance backs the rest [23]. The financial exposure is bounded; the signal is that the metric at the center of the equity story is under legal challenge while its controlling shareholder faces no election risk.
What to watch
Governance here is not a live catalyst but a standing condition on every stewardship judgment. Three checkpoints are falsifiable. First, whether the board ever appoints an independent chair or lead director while Tangney holds the vote — its absence is the cleanest read on how the board sees its own role. Second, the pace of the cheaper February-2026 buyback authorization: deployment below the DCF fair-value range (What the Price Implies) would show capital allocation improving even without an external check. Third, resolution of the engagement-metric litigation, which tests the disclosure the whole network case is built on. Until 2031, none of these is decided by a shareholder vote — they are decided inside the founder's control.
The seven chapters before this one built the pieces; this one fits them together. Whether Doximity's growth reset is a ceiling or a soft patch is genuinely two-sided, and no further analysis of the March-2026 numbers will settle it. What settles it is a short list of datable prints over the next year. At $21.77 the price already sits near the ceiling case [1]: with the stock at the ceiling column, the recovery and the AI-Search optionality carry essentially no value in the current quote.
The reconciliation
The report has assembled real evidence on both sides. The honest reading is not that one column is right and the other noise — it is that the same four-quarter window carries a datable external shock and a retention slide that reached the anchor accounts, and the two cannot yet be separated.
| The cyclical read (soft patch) | The structural read (ceiling) |
|---|---|
| A datable external cause: 16 of the top-20 pharma customers signed most-favored-nation pricing agreements with the White House in late December–early January, disrupting the annual upfront [2] | Net revenue retention fell every quarter of FY2026 — 118% → 118% → 112% → 109% — and reached the top-20 anchor cohort, from 119% to 114% [3] |
| Deals slipped rather than vanished: January pharma bookings grew at the fastest rate since the 2021 IPO [4] | Management guided FY2027 to roughly market-level growth — "more in line with the market, maybe slight outperformance" — after years of ~2× the market [5] |
| Engagement is at record levels and free cash flow rose 19% to $317M, 49% of revenue — the machine is intact [6] | Several top-20 clients moved from annual to 3–6 month commitments, cutting forward visibility [7] |
| A self-funded, near-free option: commercial AI Search launched in late April, with a ramp expected in the fiscal back half [8] | An AI-native competitor, OpenEvidence, is now named directly in the 10-K's competition disclosures [9] |
Sources: FY2026 earnings-call transcripts and the FY2026 10-K, as cited. The two reads are examined in depth in The Upfront Shock and The Moat.
The single fact that keeps both columns live is that the retention slide reached the biggest customers. A pure air-pocket in discretionary spend would spare the top-20; instead the top-20 net revenue retention fell to 114% and the over-$500,000 cohort's year-over-year growth roughly halved to 6%, with the count ticking down between the third and fourth quarters [10]. The cyclical case has an answer — the MFN shock hit exactly those anchor accounts — but the answer is a promise about money not yet collected, which the next year's prints resolve.
Three scenarios, and where the price sits
The valuation work in What the Price Implies capitalizes the same cash flow three ways. The scenarios below are not forecasts; they are the fair values that fall out of a 10% discount rate at three durable growth rates, shown on both cash bases — reported free cash flow (~$317M) and the stricter owner cash that nets out stock compensation (~$205M).
Scenario fair values from the chapter-5 DCF (10% WACC, five-year explicit plus Gordon terminal), on reported FCF ~$317M and SBC-adjusted owner cash ~$205M [11]. Not a forecast; a map from growth assumption to value.
Two things fall out of this table. First, the $21.77 price sits between the ceiling and steady cases on reported free cash flow, and at the steady case on the stricter owner-cash base — so the market is not pricing decline, but it is pricing something close to no durable growth, and it awards the AI-Search re-acceleration column essentially nothing [12]. Second, the spread that matters is not ceiling-versus-re-acceleration; it is which cash base you capitalize. The $122 million of stock compensation that lifts Doximity's free cash flow to $317 million above its $196 million of net income is also what decides its valuation: on reported free cash flow it trades at ~10x, but net that compensation out and owner cash is ~$205 million — ~16x, whose steady-growth DCF is ~$21, essentially today's $21.77 price. On reported FCF even the ceiling case is near today's price and the steady case is ~40% above it; on owner cash the steady case is today's price. The stock is cheap only if you both believe growth holds near 5% and accept the pre-stock-compensation cash number.
The signals that resolve it
Because the reconciliation cannot be closed from the March-2026 record, the useful output of this report is not a verdict but a watch-list — specific, datable prints, each of which pushes the read toward cyclical or structural. As of this writing the first fiscal-2027 quarter (ended June 2026) has not yet been reported, so every item below is live.
| Signal | What confirms cyclical | What confirms structural | When it prints |
|---|---|---|---|
| Double-digit exit — management's benchmark to exit the calendar year as a double-digit grower | Growth re-accelerating through the fiscal back half toward double digits | Growth stuck at or below the guided ~4% into calendar year-end | Q3 FY2027 (Feb 2027) |
| AI Search revenue — first commercial deals closed late April, ramp guided to the fiscal back half [13] | Disclosed, growing AI-Search revenue; the option starts to pay | Silence or de-emphasis; the option stays theoretical while the cost stays in the P&L | Q2–Q3 FY2027 |
| NRR stabilization — the four-quarter slide to 109%, top-20 to 114% [14] | Net revenue retention flattens or ticks up, especially in the top-20 | Continued decline through 109%, with the anchor cohort still eroding | Each quarter |
| Commitment horizon — top-20 clients moved to 3–6 month buys [15] | A return to annual commitments as policy noise fades | The shorter horizon persists — a durable change in how pharma buys | FY2027 calls |
| Buyback at the cheaper price — $493M remaining, now deploying below the DCF range [16] | Aggressive repurchase at ~$22 shrinks the count materially | Slow deployment, or spend that again leads the price | Each quarter |
| Peer confirmation — is the HCP digital-ad softness market-wide? | Medscape/WebMD and OPRX report the same upfront disruption | The weakness looks Doximity-specific — lost share, not a soft market | Peer prints |
Signal thresholds drawn from management's own FY2026 commentary and guidance, as cited. The management benchmark and booking mechanics are set out in The Upfront Shock.
The order of these signals matters. The double-digit exit and NRR stabilization arrive first and speak to the cycle; AI-Search disclosure arrives later and speaks to the structure. A reader watching only the second, more exciting question will get the answer to the first one — is the base business cyclical or capped — several quarters sooner, and that is the answer the price is most sensitive to today.
What this leaves the reader with
The decisive variable is narrow: whether the top-20 pharma budgets that slipped past the December upfront are spent later at a normal rate, or spent smaller — or not at all. If they return, the ceiling case is wrong and a stock priced near no-growth re-rates on a cash stream that never broke [17]. If the anchor-account retention keeps sliding through 109% while AI Search stays a slide, the market's re-rate to ~10× free cash flow will look early rather than wrong. The asymmetry is real but not free: the current price already discounts the ceiling case, while the same policy shock that could be dismissed as timing is the one thing that reached the customers a ceiling would claim. The report's contribution is to have made the ceiling-versus-cycle question falsifiable — and to have named the quarters in which it gets its answer.