Doximity, Inc.'s management explains the business in its own materials. The slides below do the most of that work, pulled from the documents preserved in Sources. Each source link opens the complete presentation at that slide in a new tab.
Management's current, self-contained explainer: what the platform is, how it makes money, the AI push, the market and the latest financials. · Open the full document →
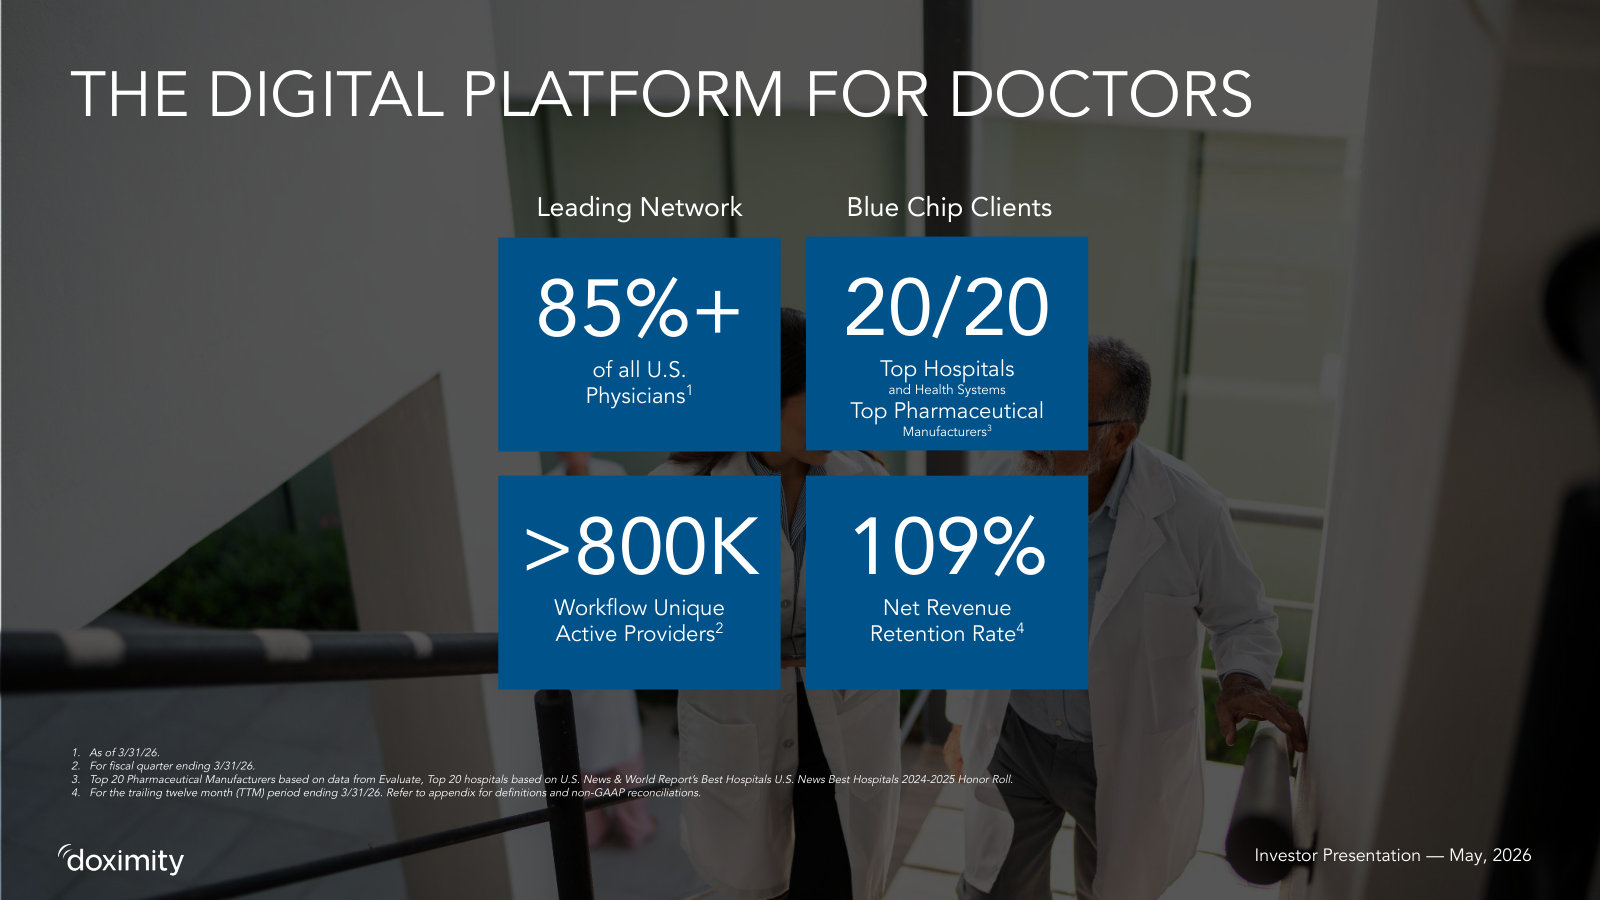
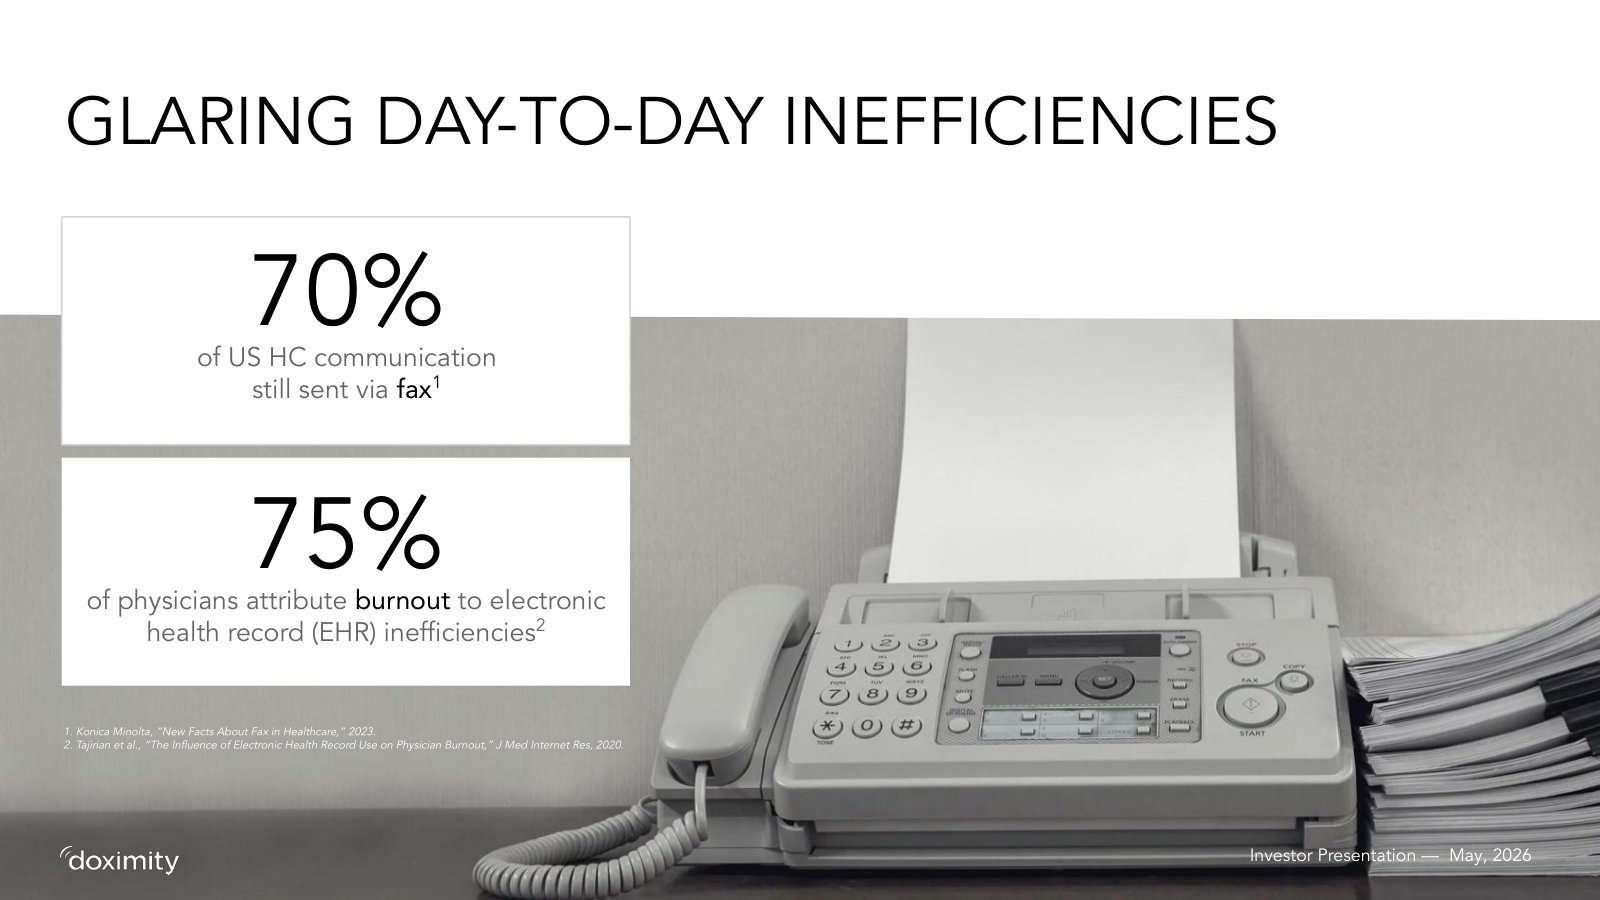
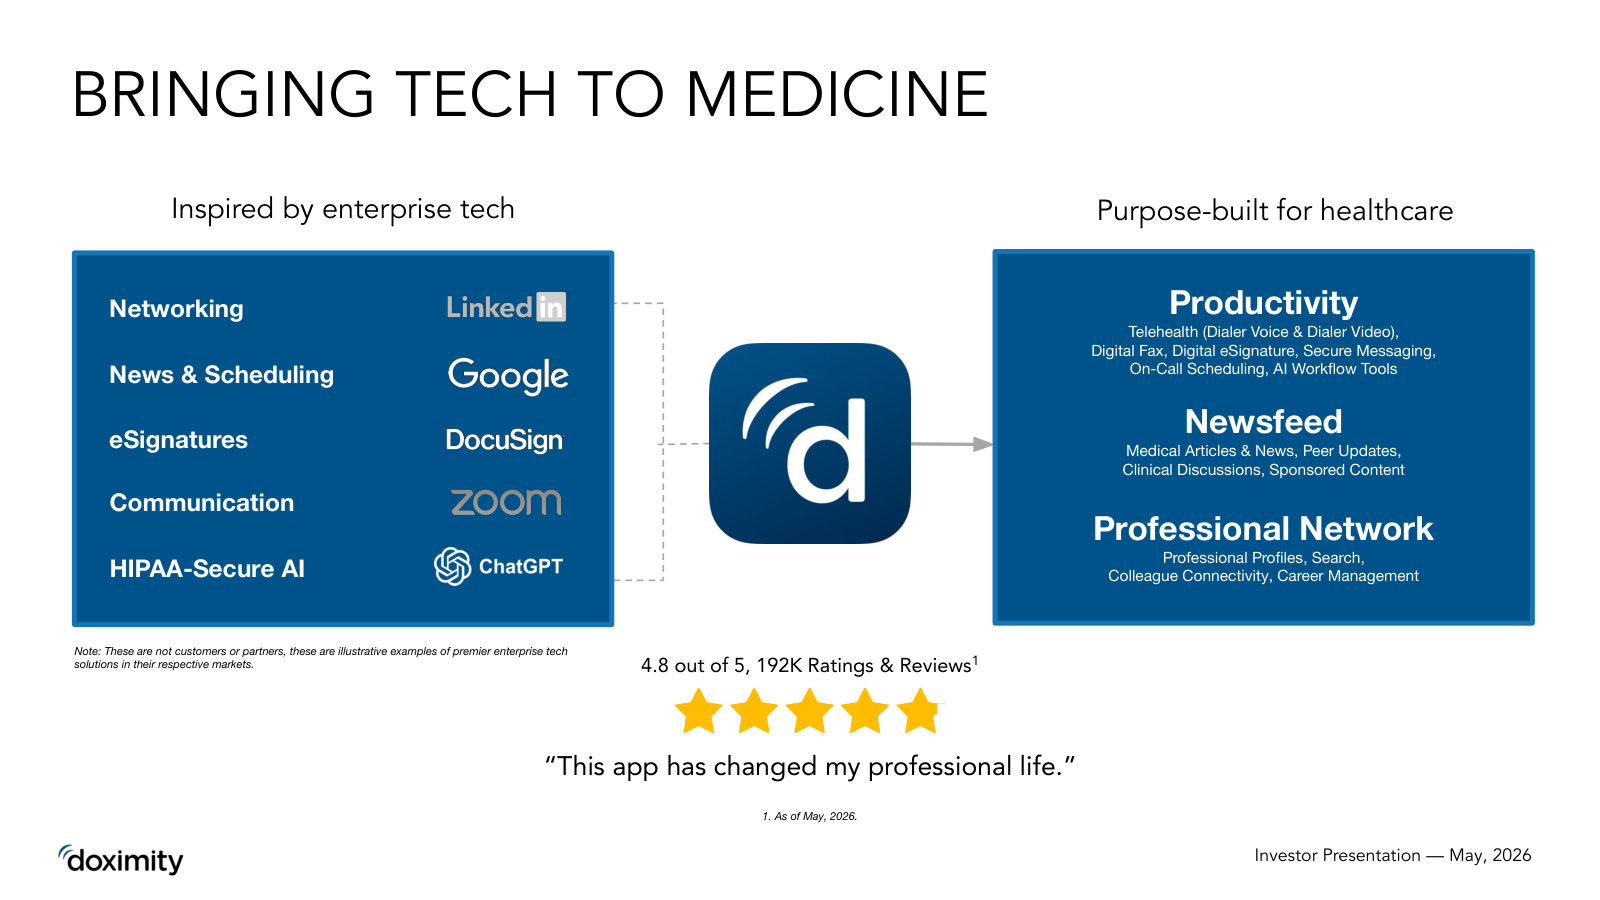
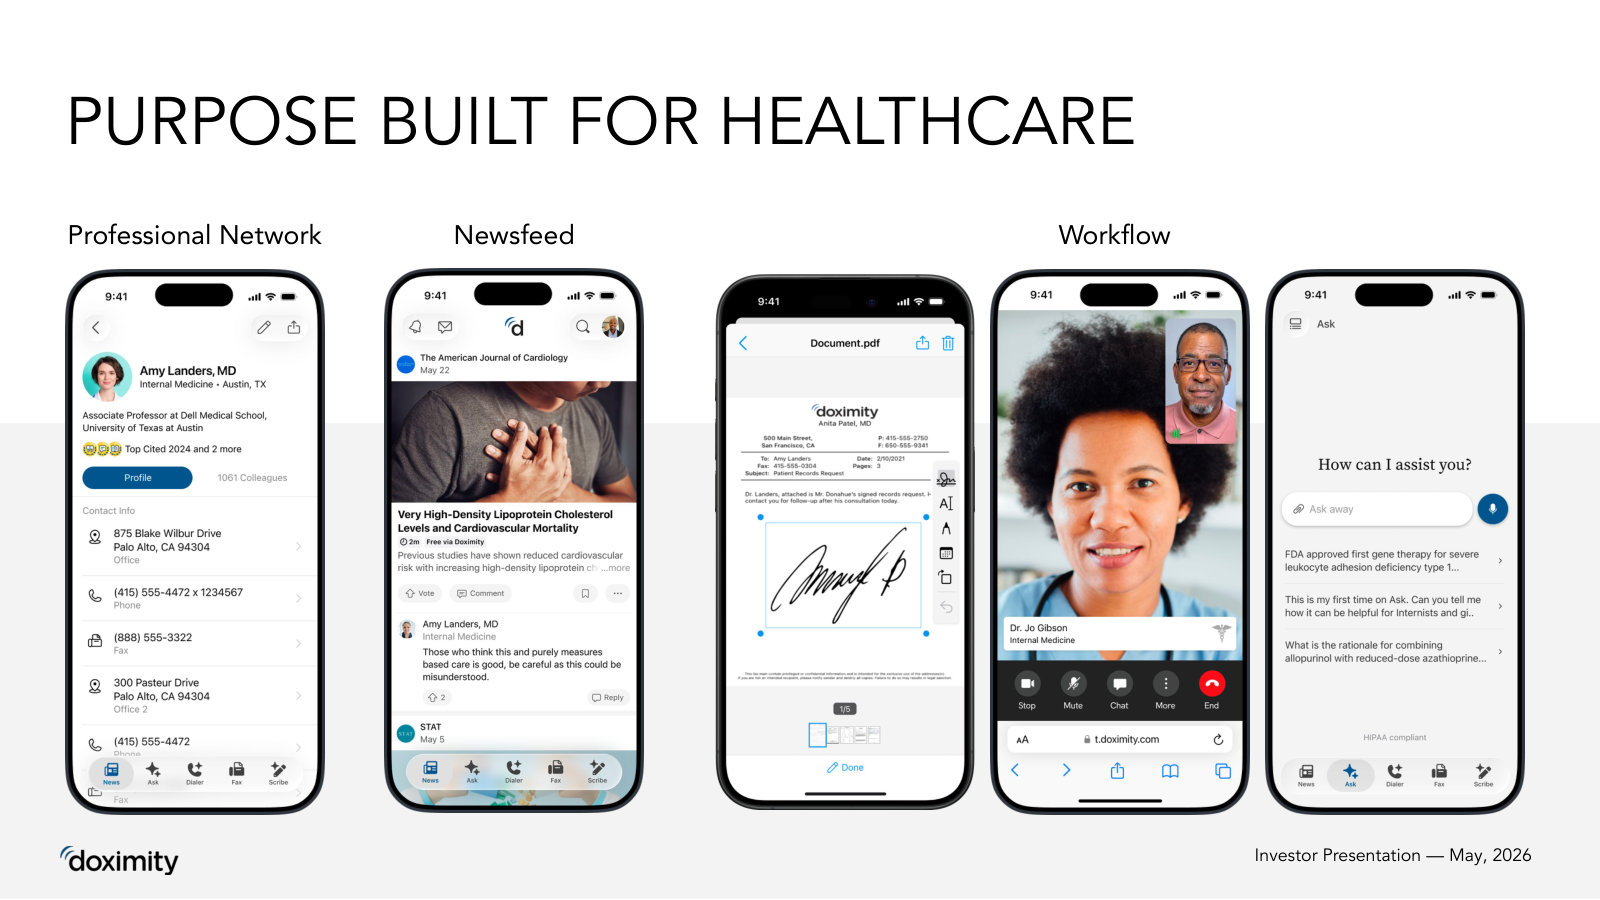
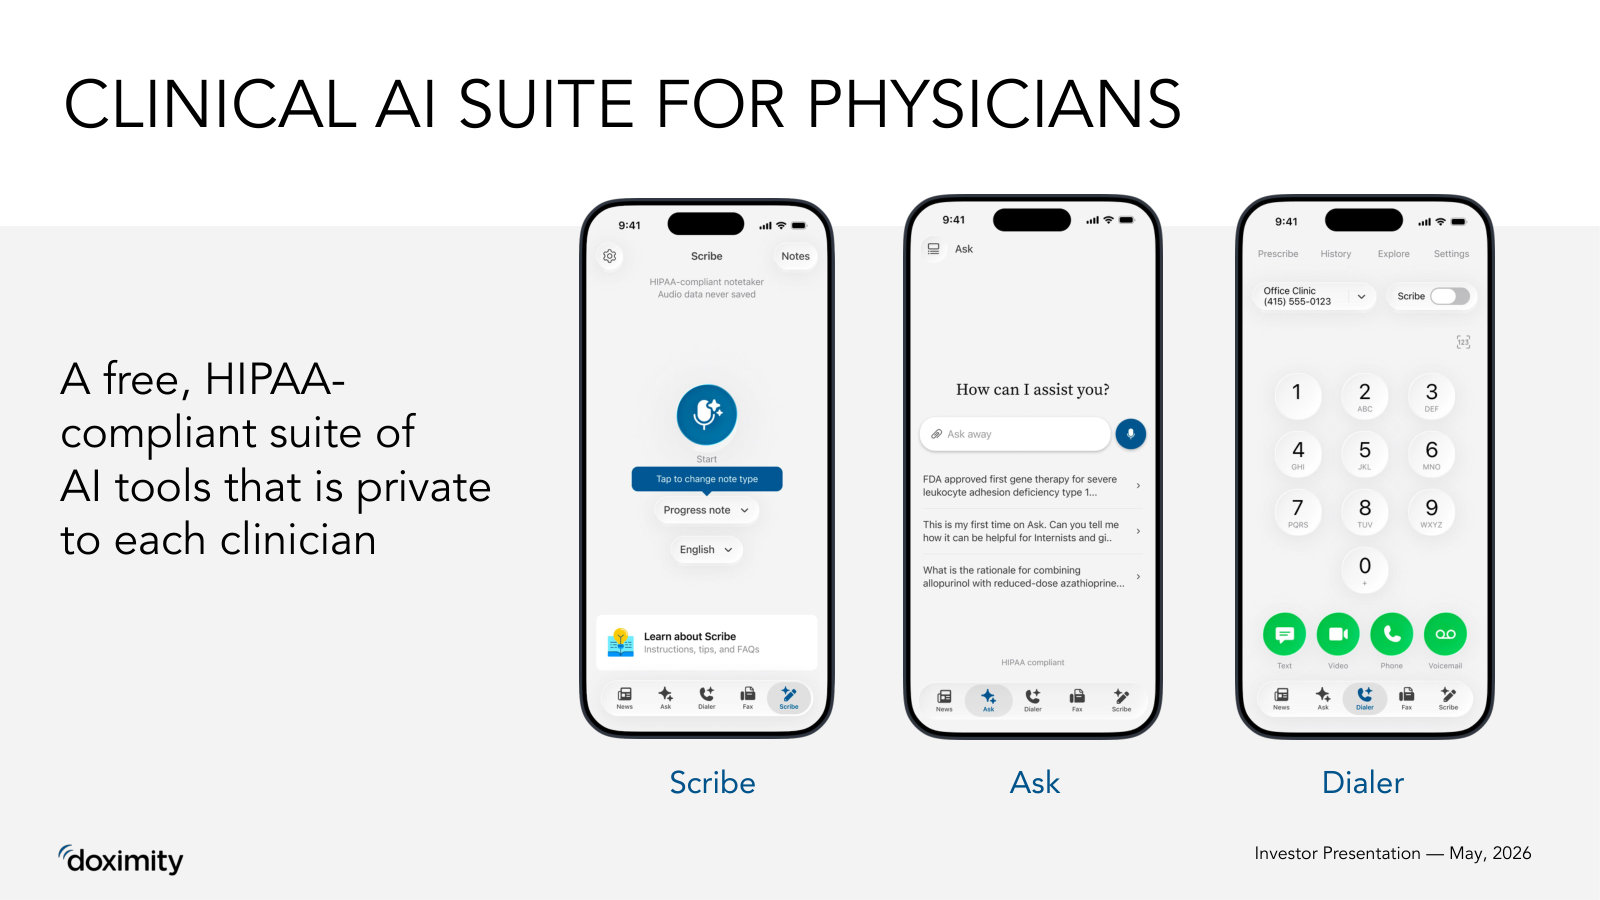
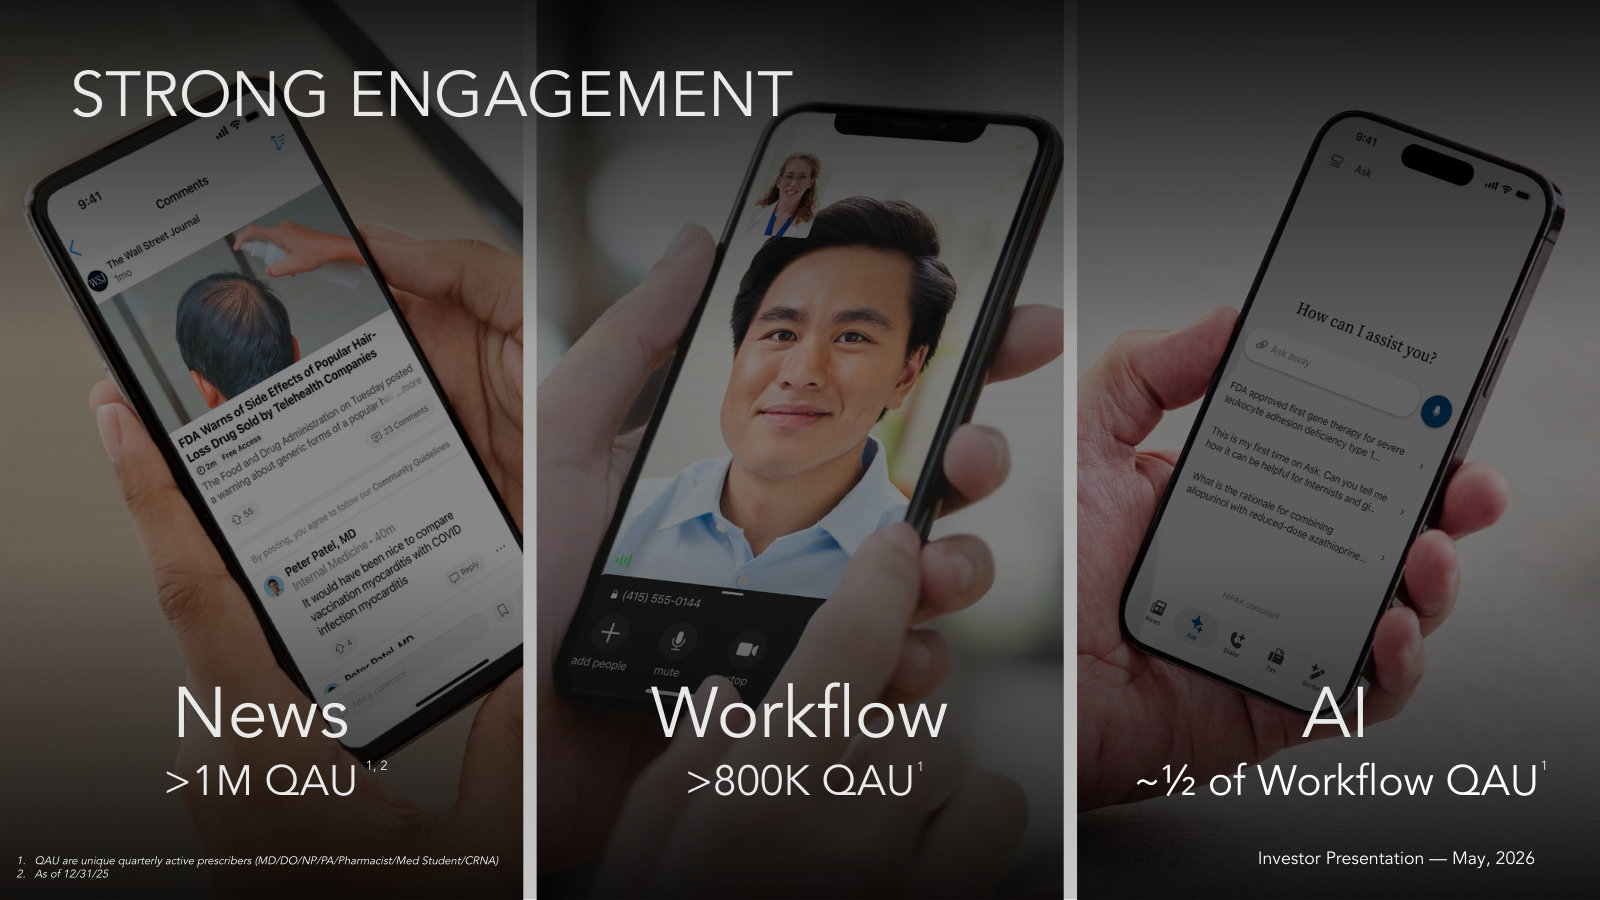
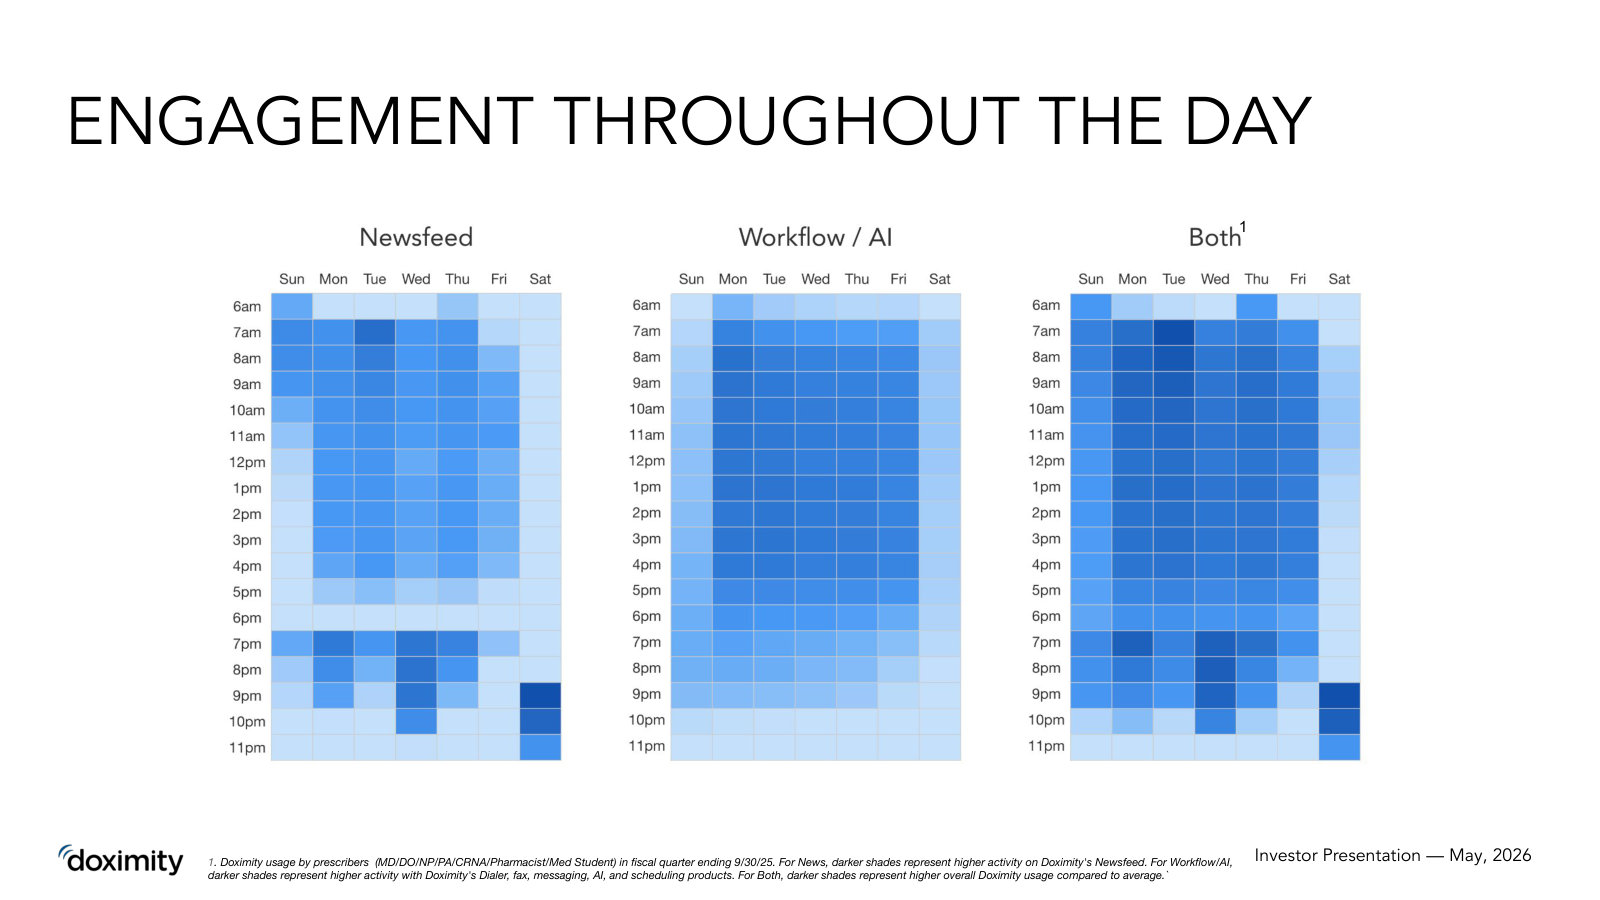
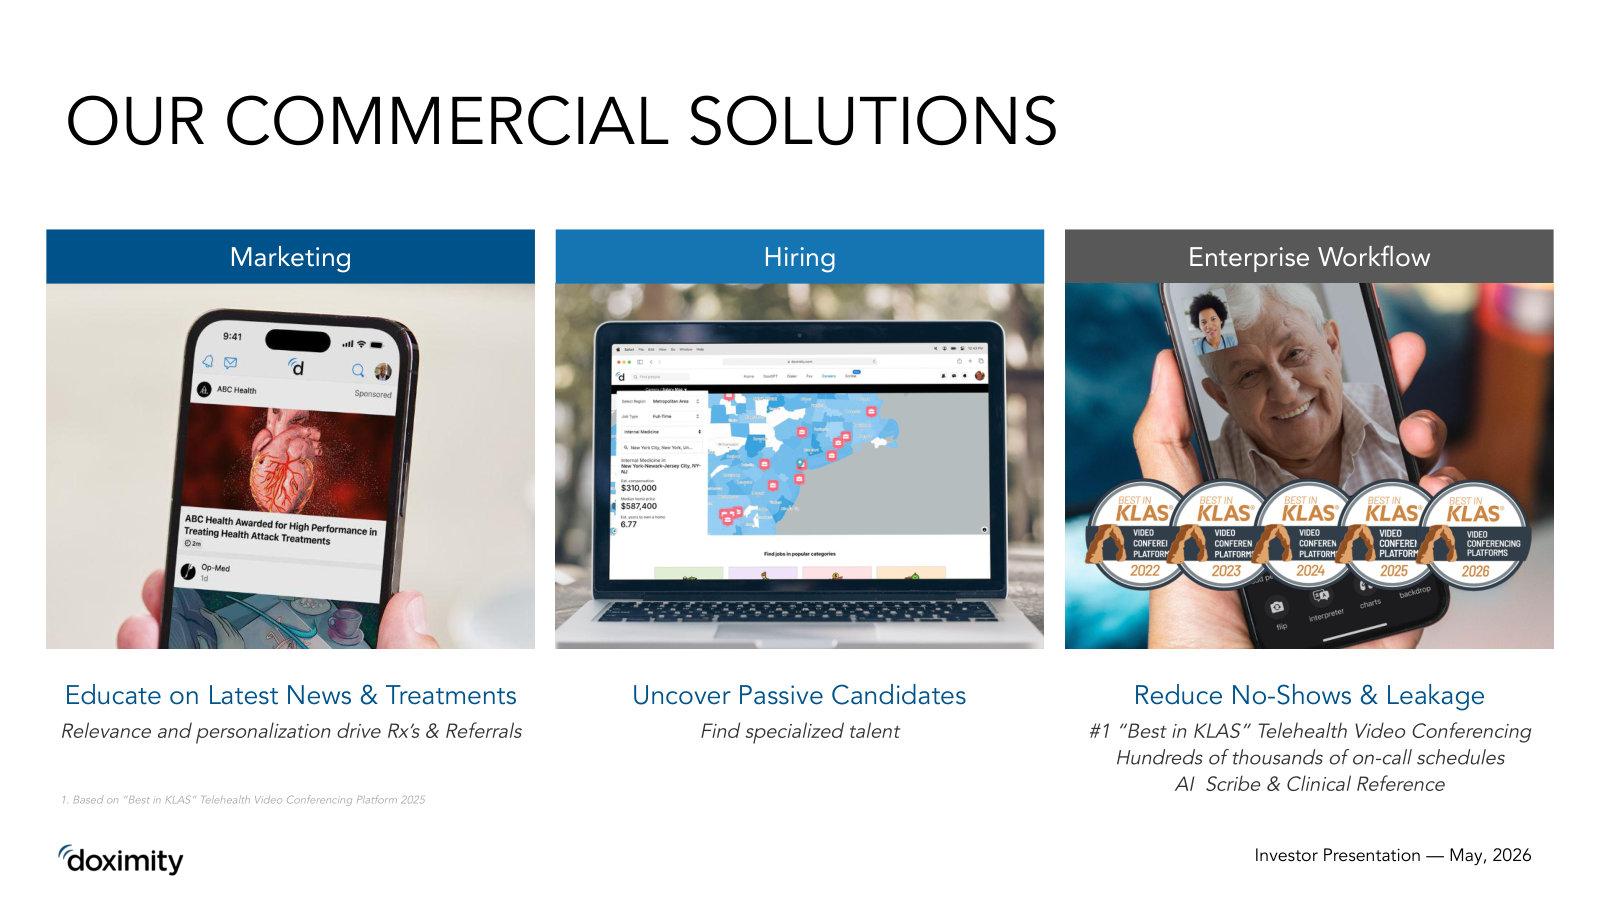
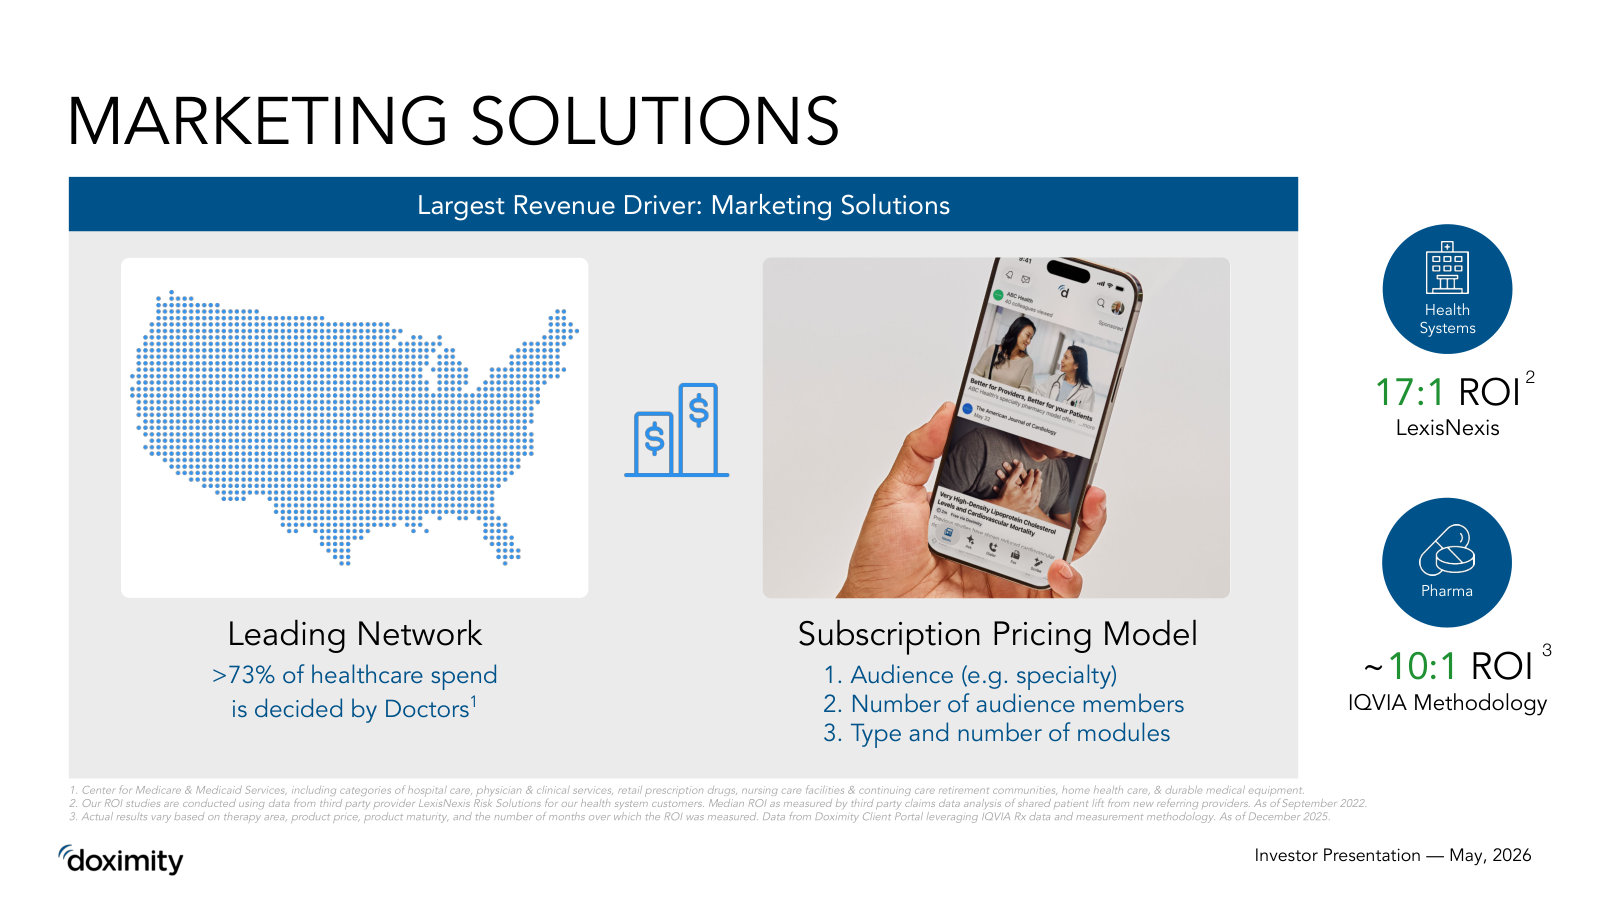
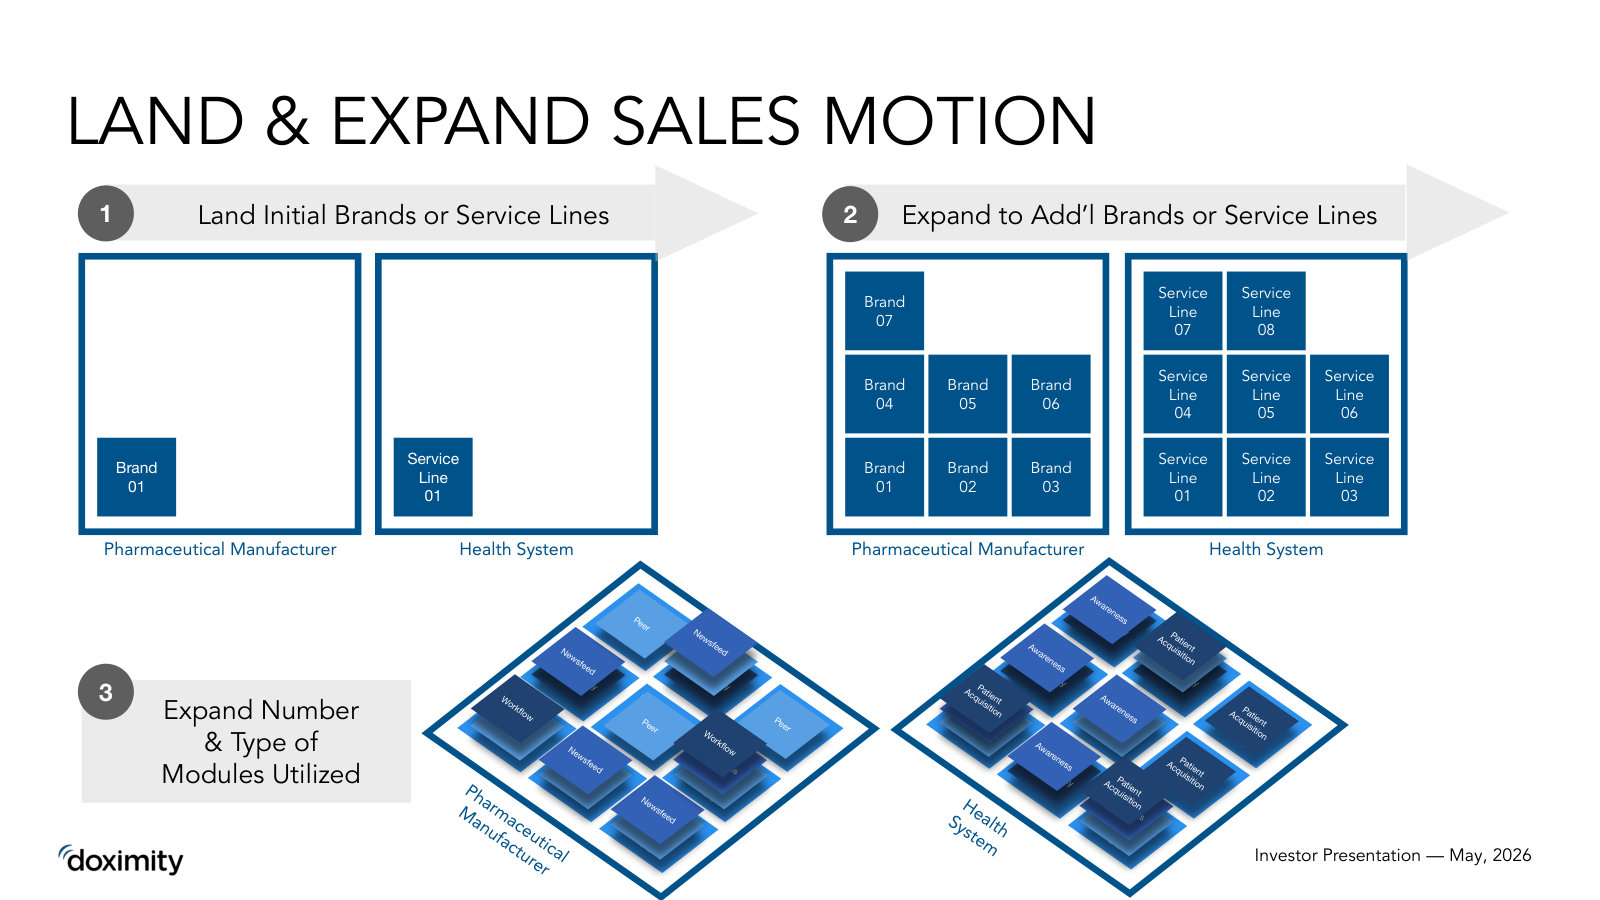
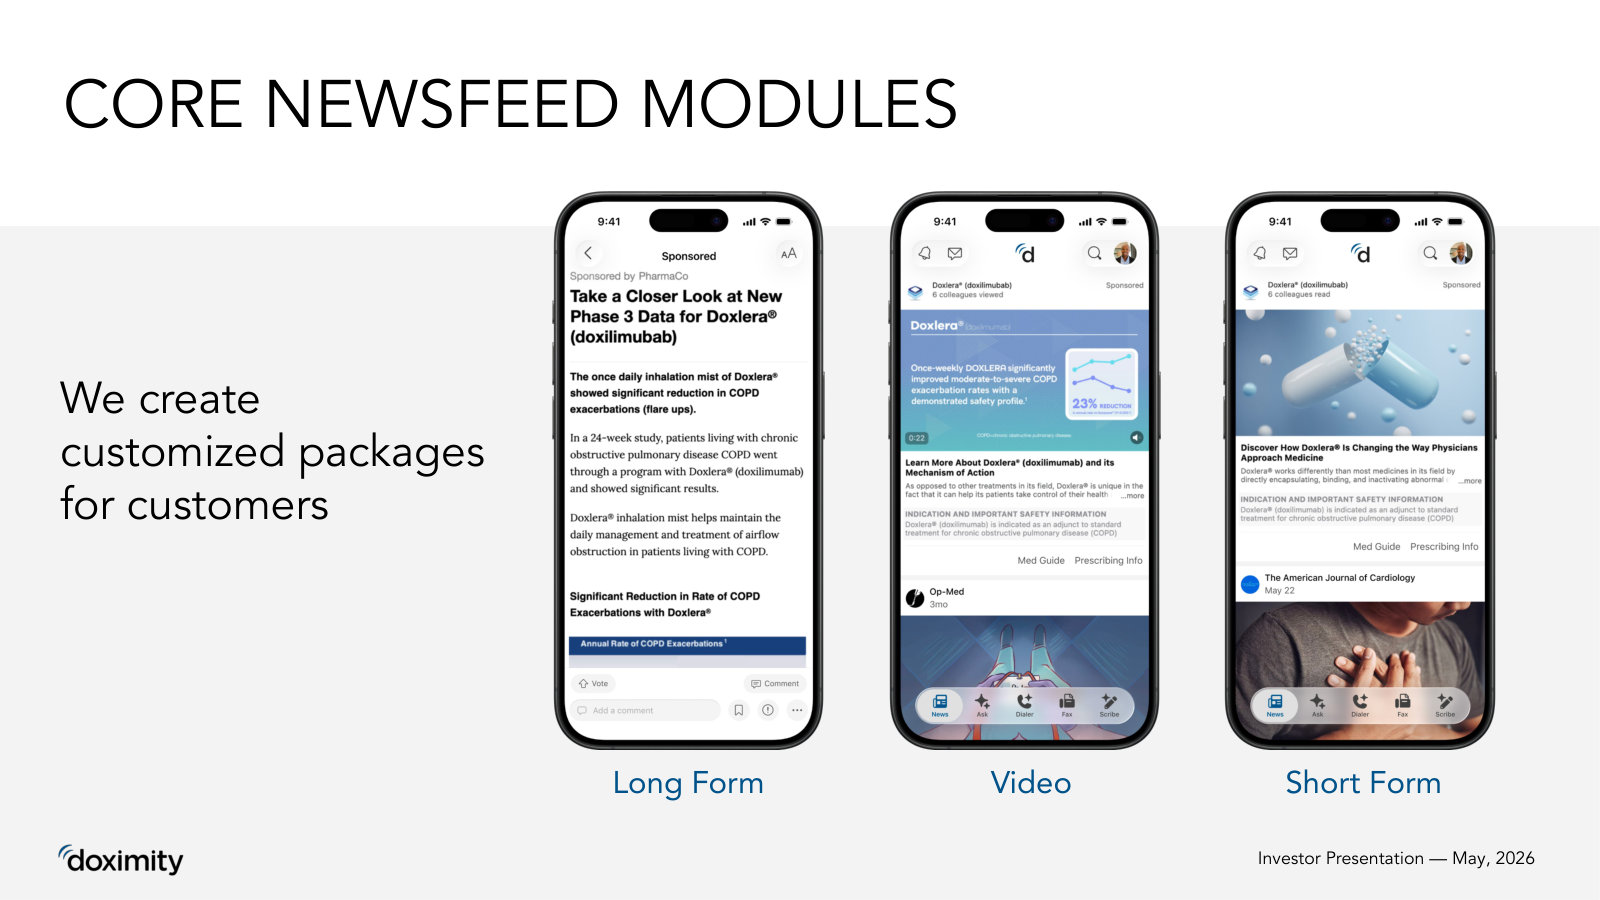
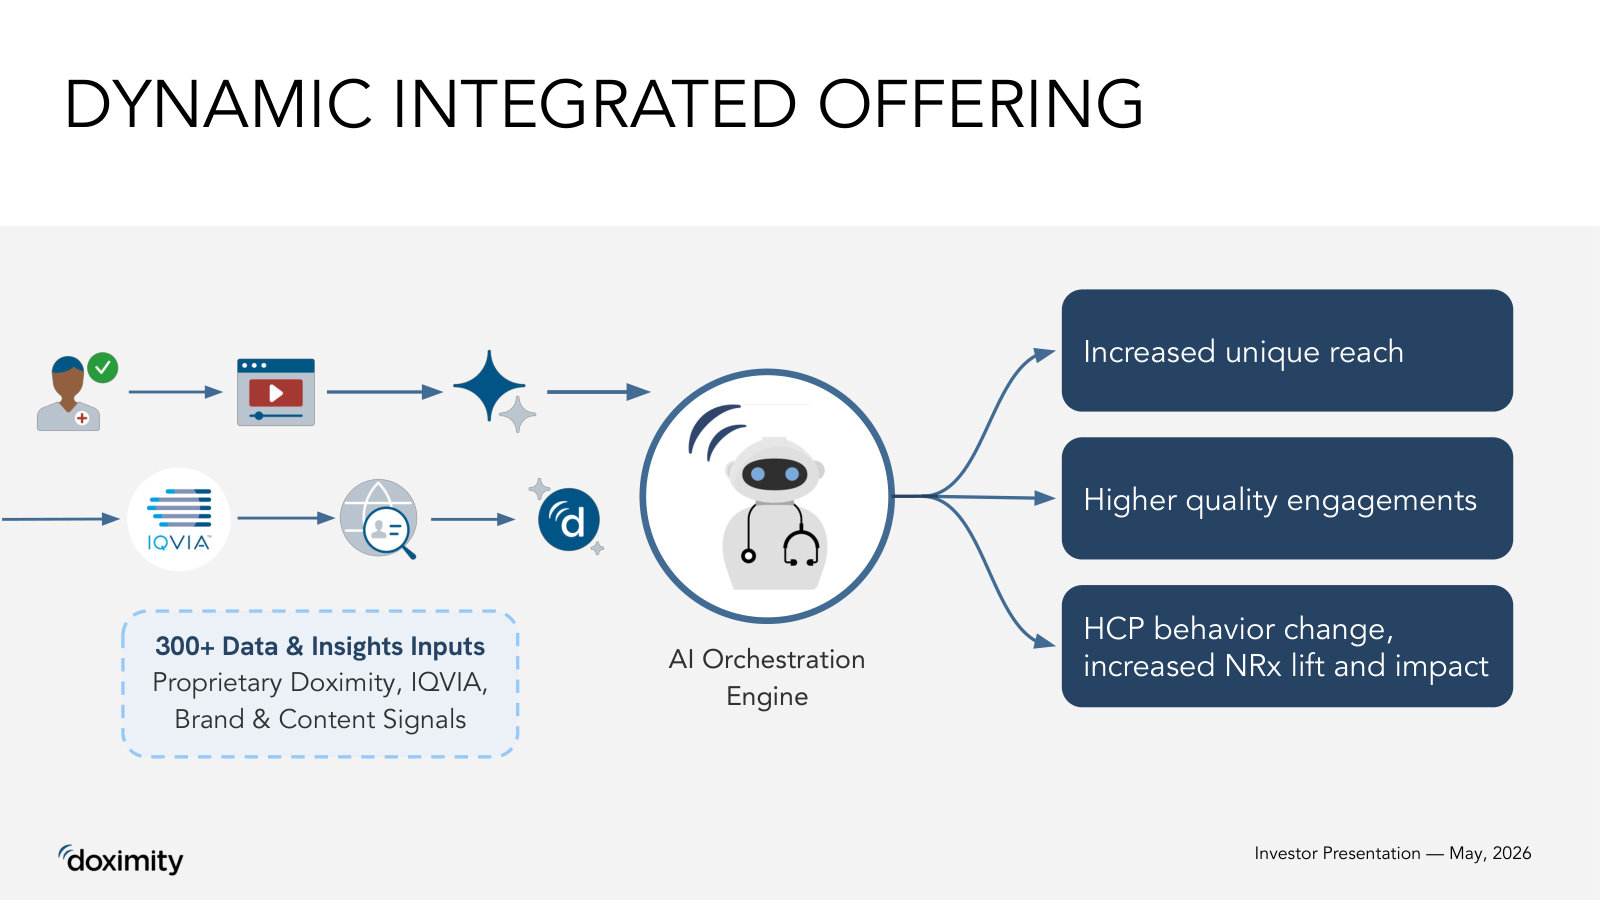
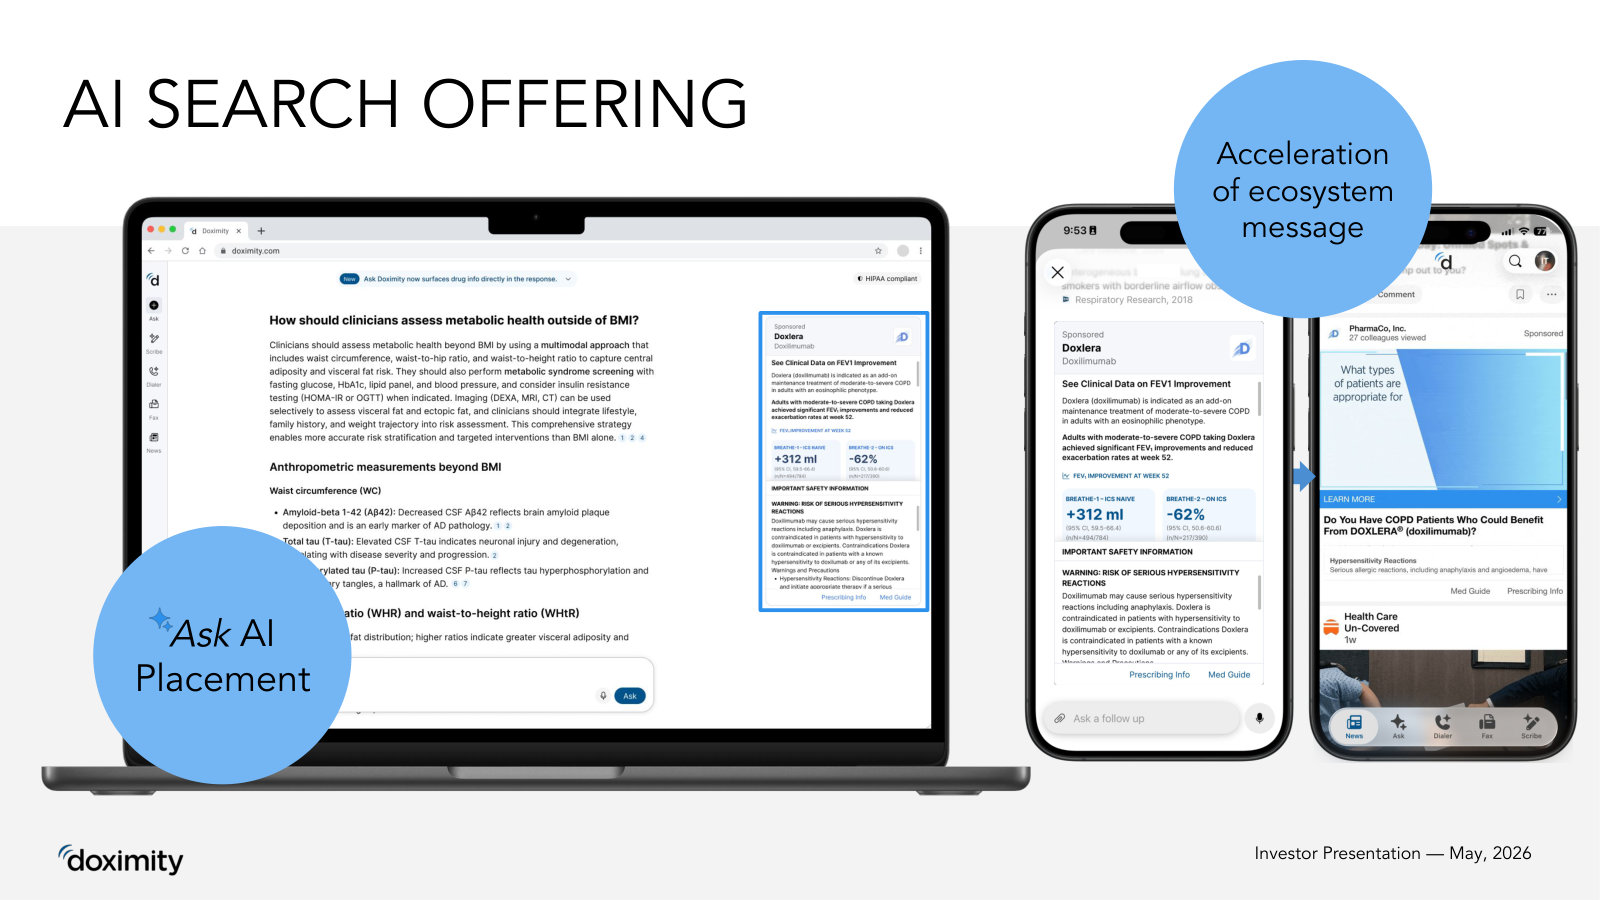
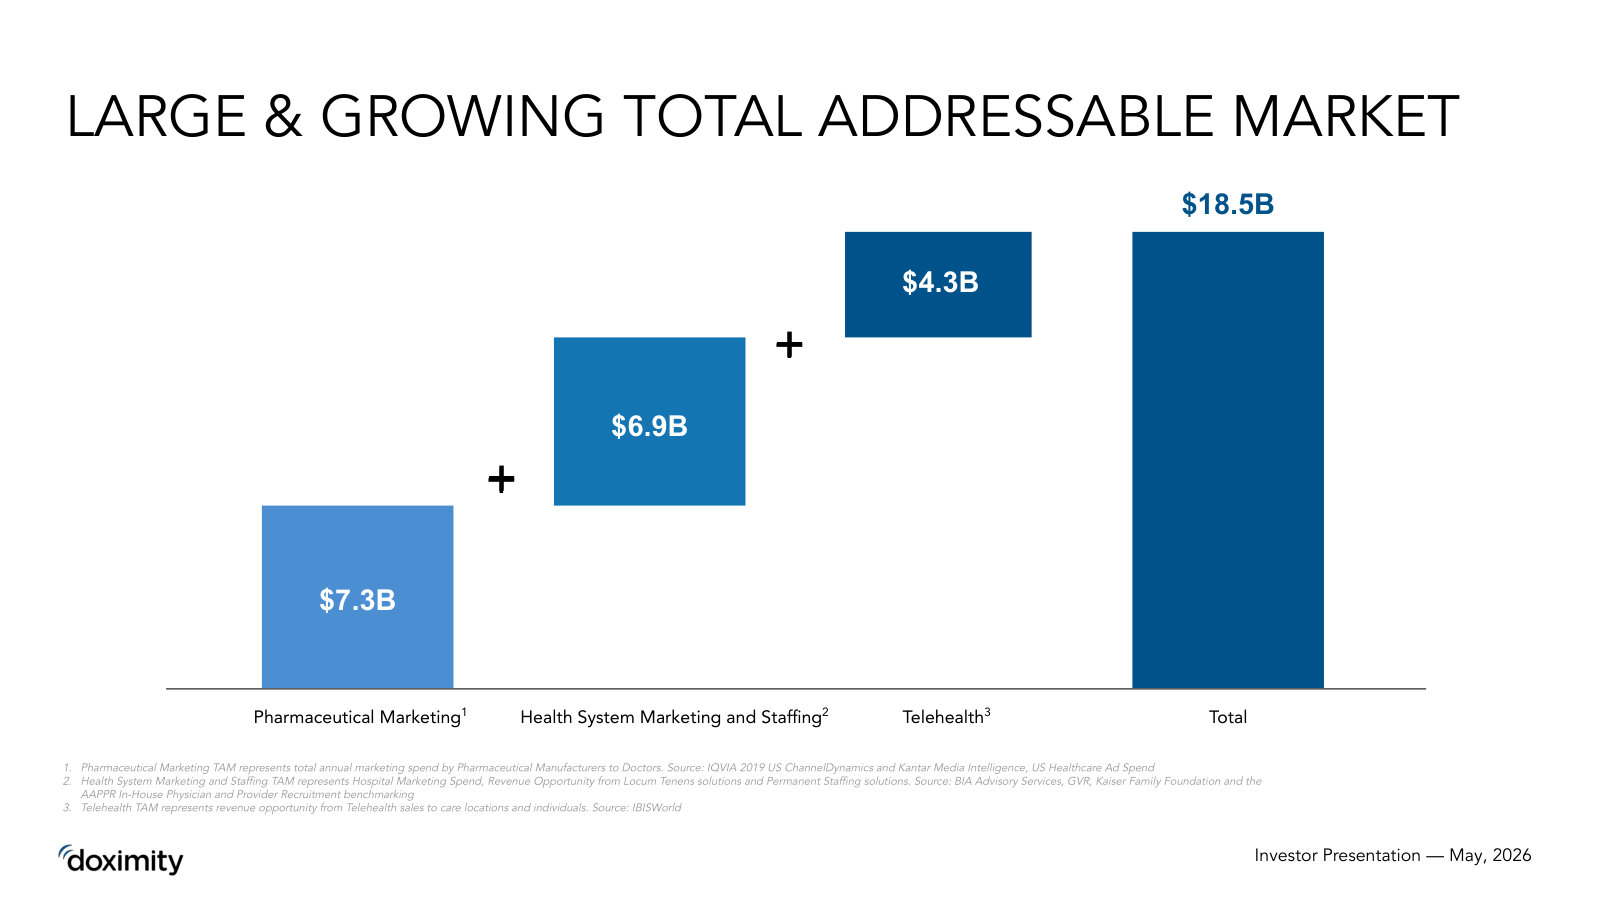
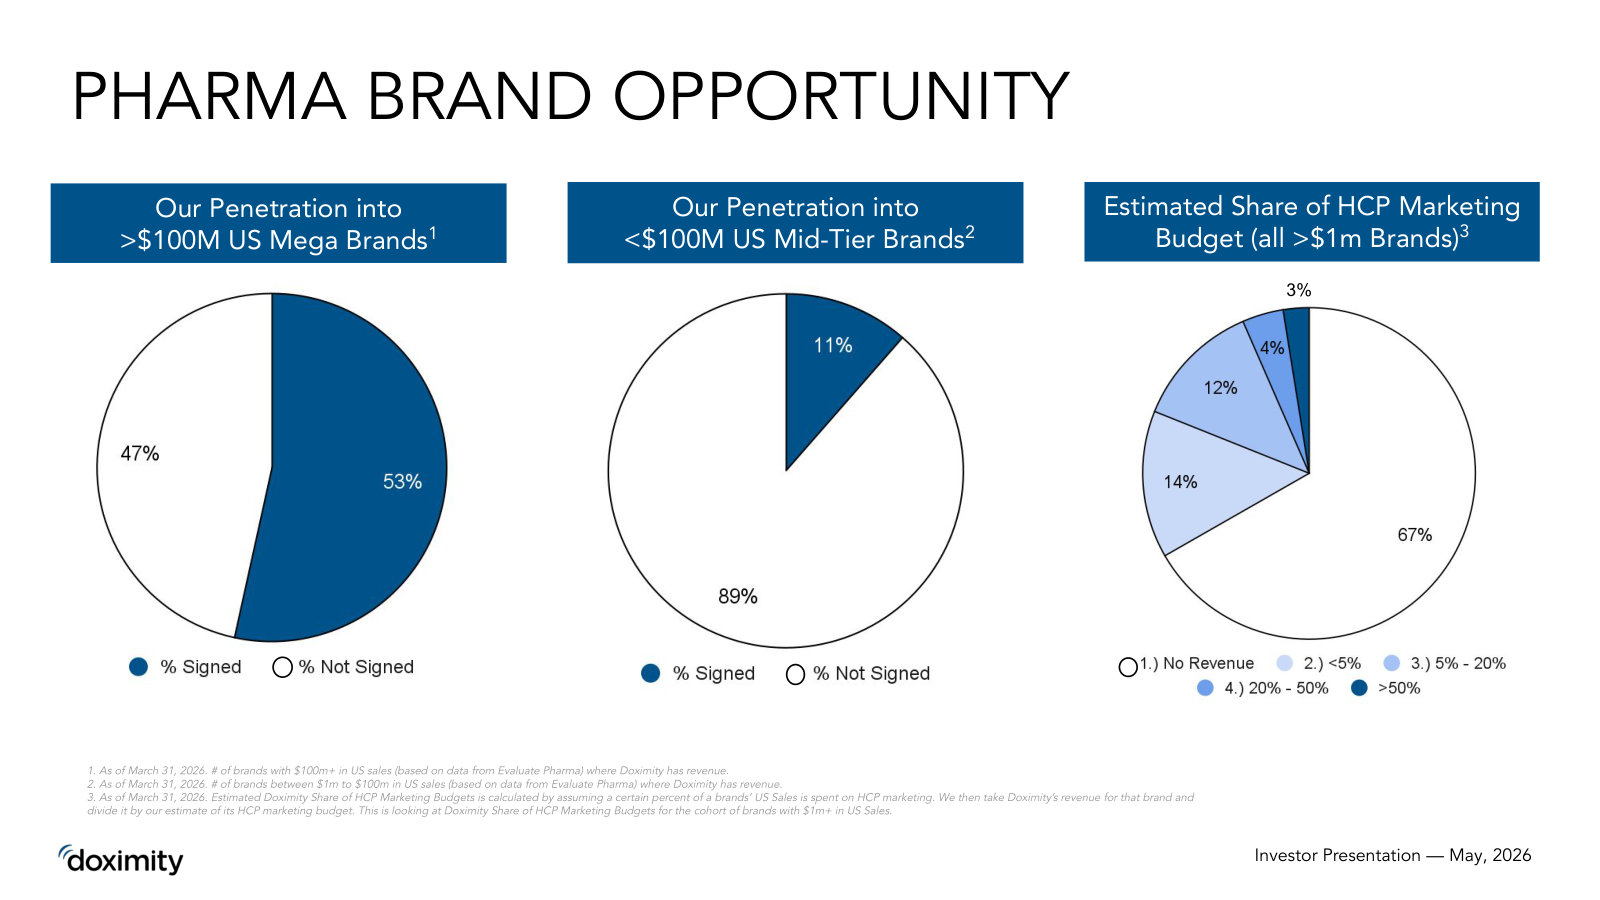
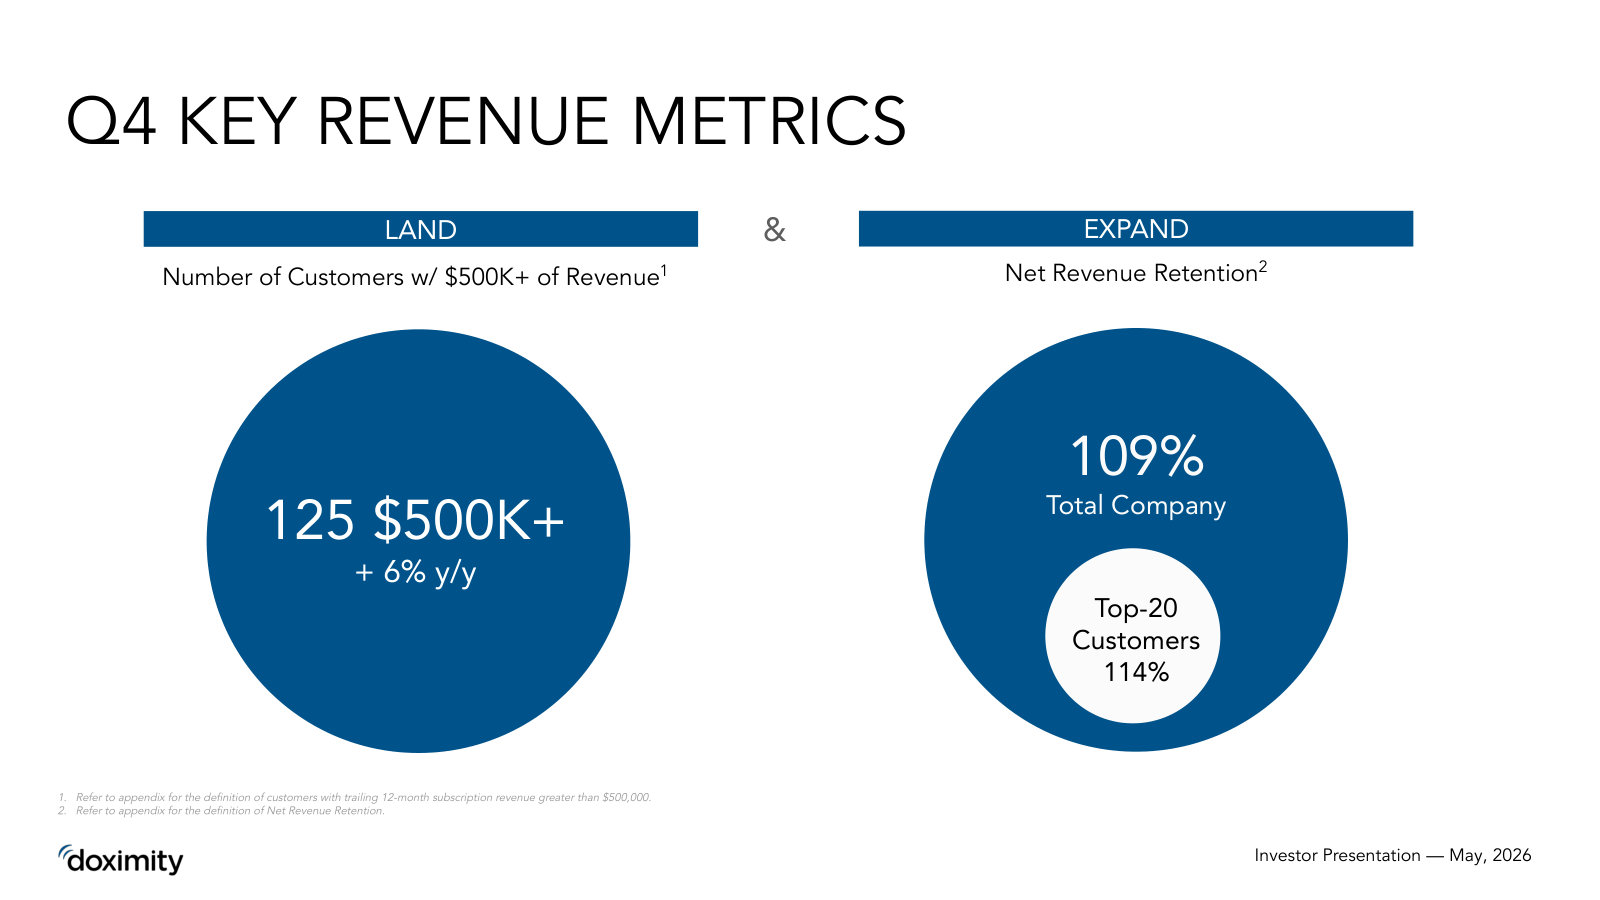
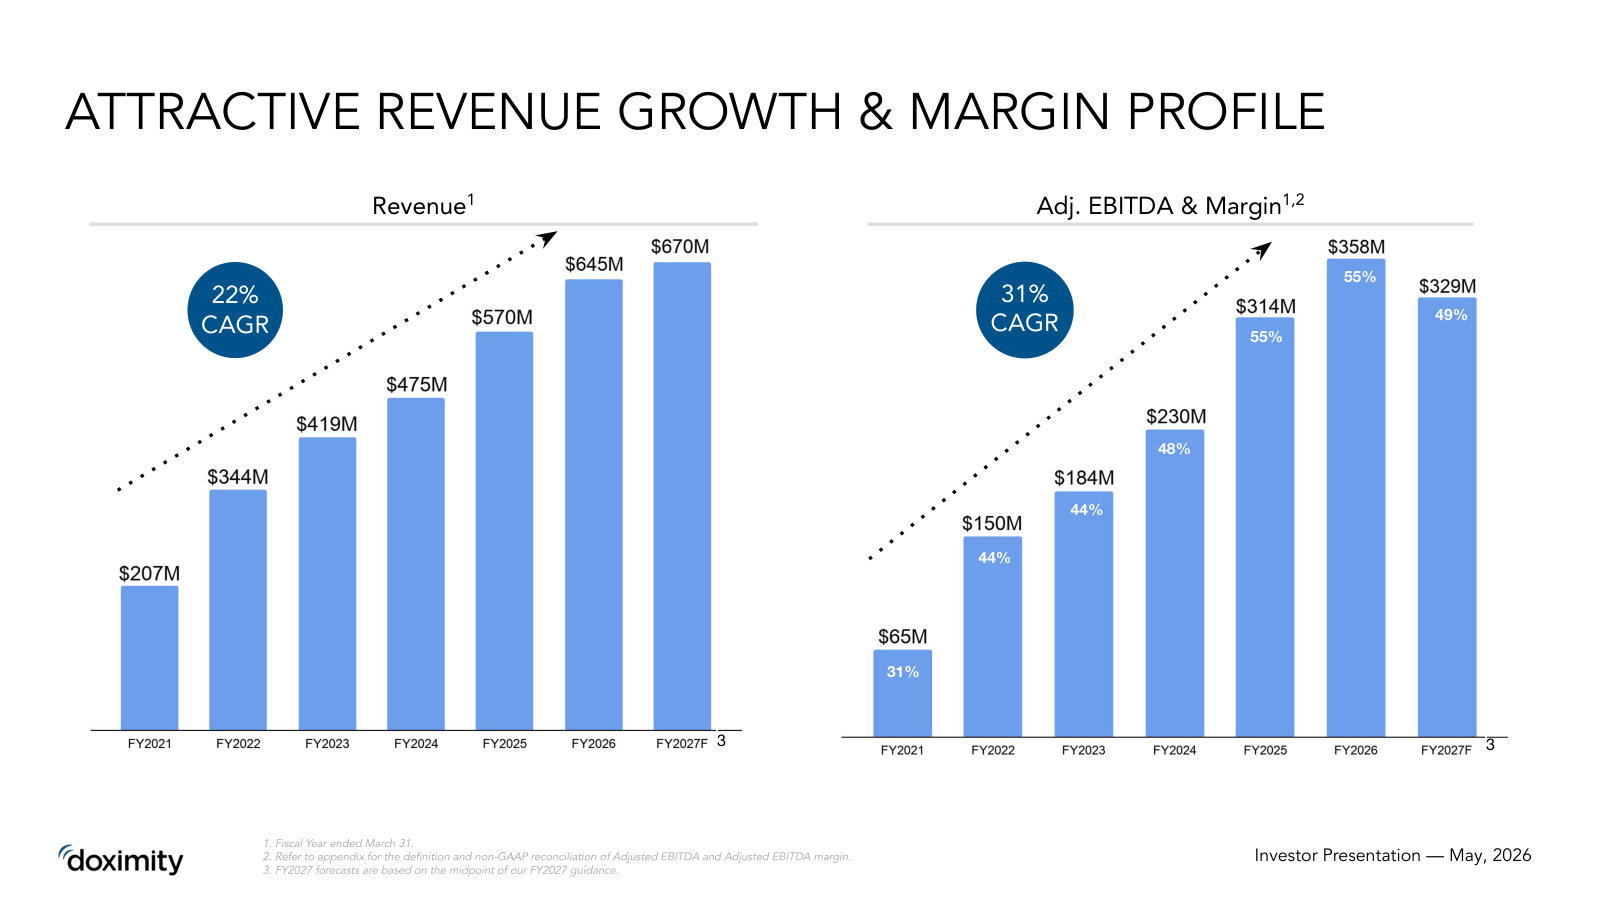
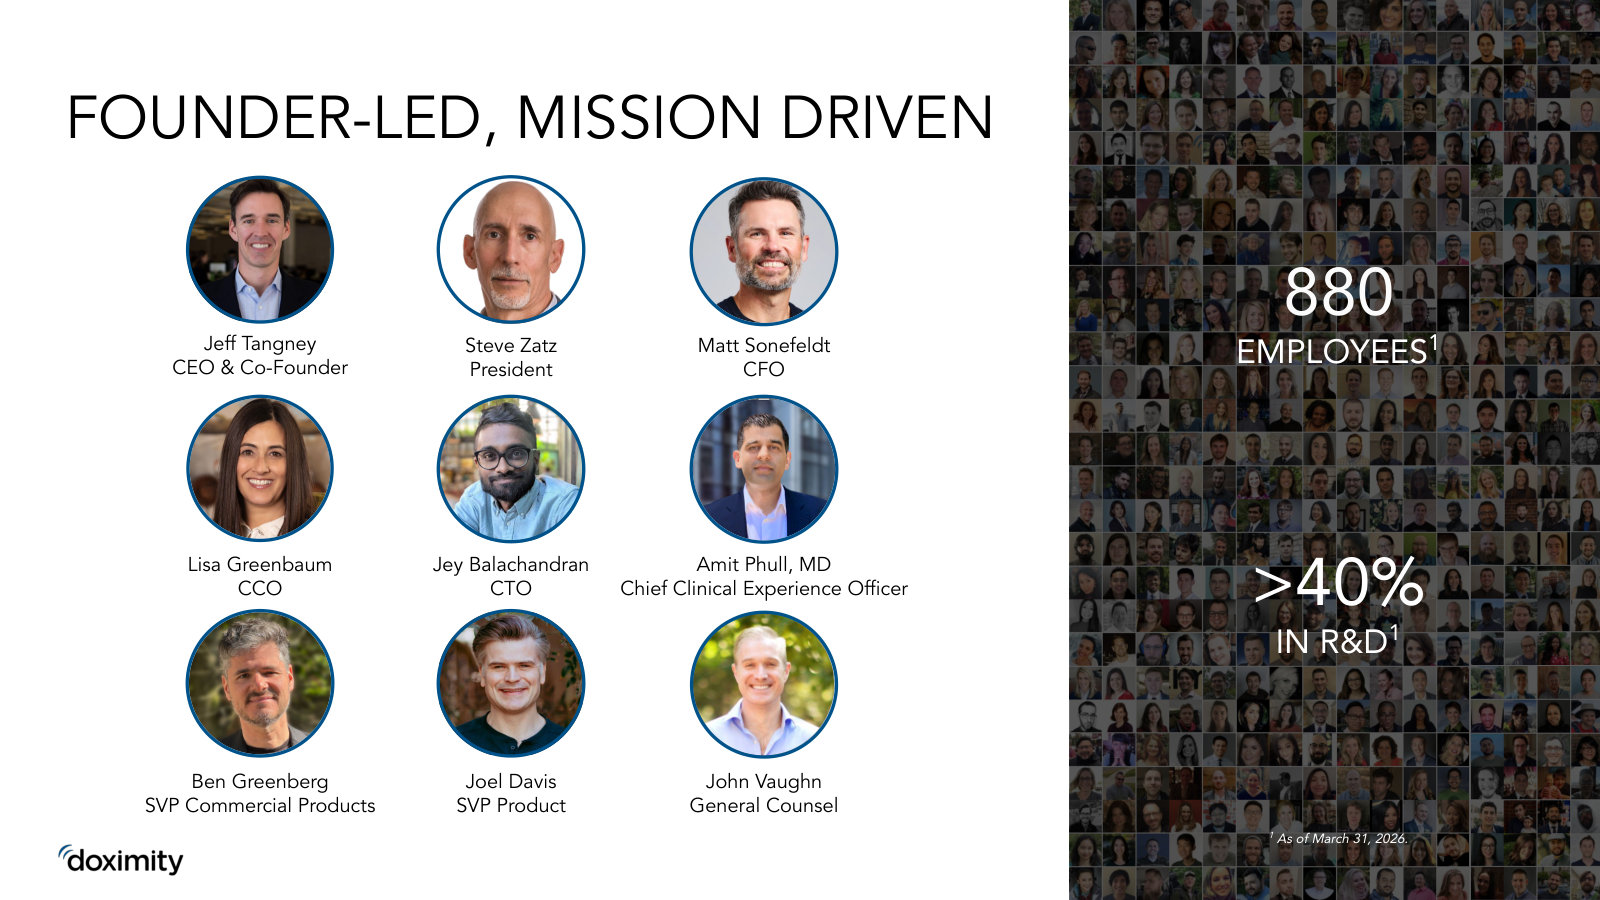
p. 3 — The business in four numbers: 85%+ of U.S. physicians on the network, top-20 hospital and pharma clients, 800K+ workflow users, 109% NRR. · Open the full presentation →p. 4 — The problem it sells against — 70% of U.S. healthcare communication still runs on fax, and EHRs drive most physician burnout. · Open the full presentation →p. 5 — The pitch in one frame: familiar consumer-tech categories (LinkedIn, Zoom, DocuSign, ChatGPT) rebuilt purpose-built for medicine. · Open the full presentation →p. 6 — What physicians actually use — profile/network, newsfeed, digital fax, telehealth calls and the Ask AI assistant, shown on-device. · Open the full presentation →p. 7 — The free Clinical AI Suite — Scribe (notes), Ask (clinical Q&A) and the Dialer — the tools that pull doctors onto the platform daily. · Open the full presentation →p. 9 — Engagement by product line: >1M quarterly active users on news, >800K on workflow, roughly half of workflow users now on AI. · Open the full presentation →p. 10 — How embedded the app is in a clinician's day — usage heatmaps across newsfeed, workflow/AI and both, morning through night. · Open the full presentation →p. 11 — The three ways it makes money: pharma and health-system marketing, physician hiring, and enterprise telehealth workflow. · Open the full presentation →p. 12 — Marketing is the largest revenue driver — a subscription priced on audience, size and module count, with 10–17:1 client ROI claims. · Open the full presentation →p. 13 — The land-and-expand motion — start with one brand or service line, then add more brands, service lines and module types. · Open the full presentation →p. 14 — What a marketing 'module' looks like — long-form, video and short-form sponsored newsfeed placements built for each client. · Open the full presentation →p. 16 — How the ad engine works — 300+ Doximity and IQVIA data inputs feed an AI orchestration layer aimed at measurable prescription lift. · Open the full presentation →p. 17 — The newest surface: sponsored placements inside Ask AI answers, extending the marketing model into clinical search. · Open the full presentation →p. 18 — The $18.5B addressable market — pharma marketing, health-system marketing/staffing and telehealth added together. · Open the full presentation →p. 19 — Room to grow: signed into 53% of >$100M mega-brands but only 11% of mid-tier brands, and a low share of total HCP marketing budgets. · Open the full presentation →p. 20 — The quarter's core metrics — 125 customers at $500K+ revenue (land) and 109% net revenue retention, 114% for the top 20 (expand). · Open the full presentation →p. 21 — The financial track record and outlook — 22% revenue CAGR toward ~$645M and ~55% adjusted EBITDA margins, with FY2027 guidance. · Open the full presentation →p. 22 — Founder-led management and org shape — Tangney still CEO, 880 employees with over 40% in R&D. · Open the full presentation →
The fullest strategic deep-dive Doximity has published — market structure, the pharma-marketing thesis and multi-year unit economics the quarterly decks only summarize. Content is the June 2023 Investor Day. · Open the full document →
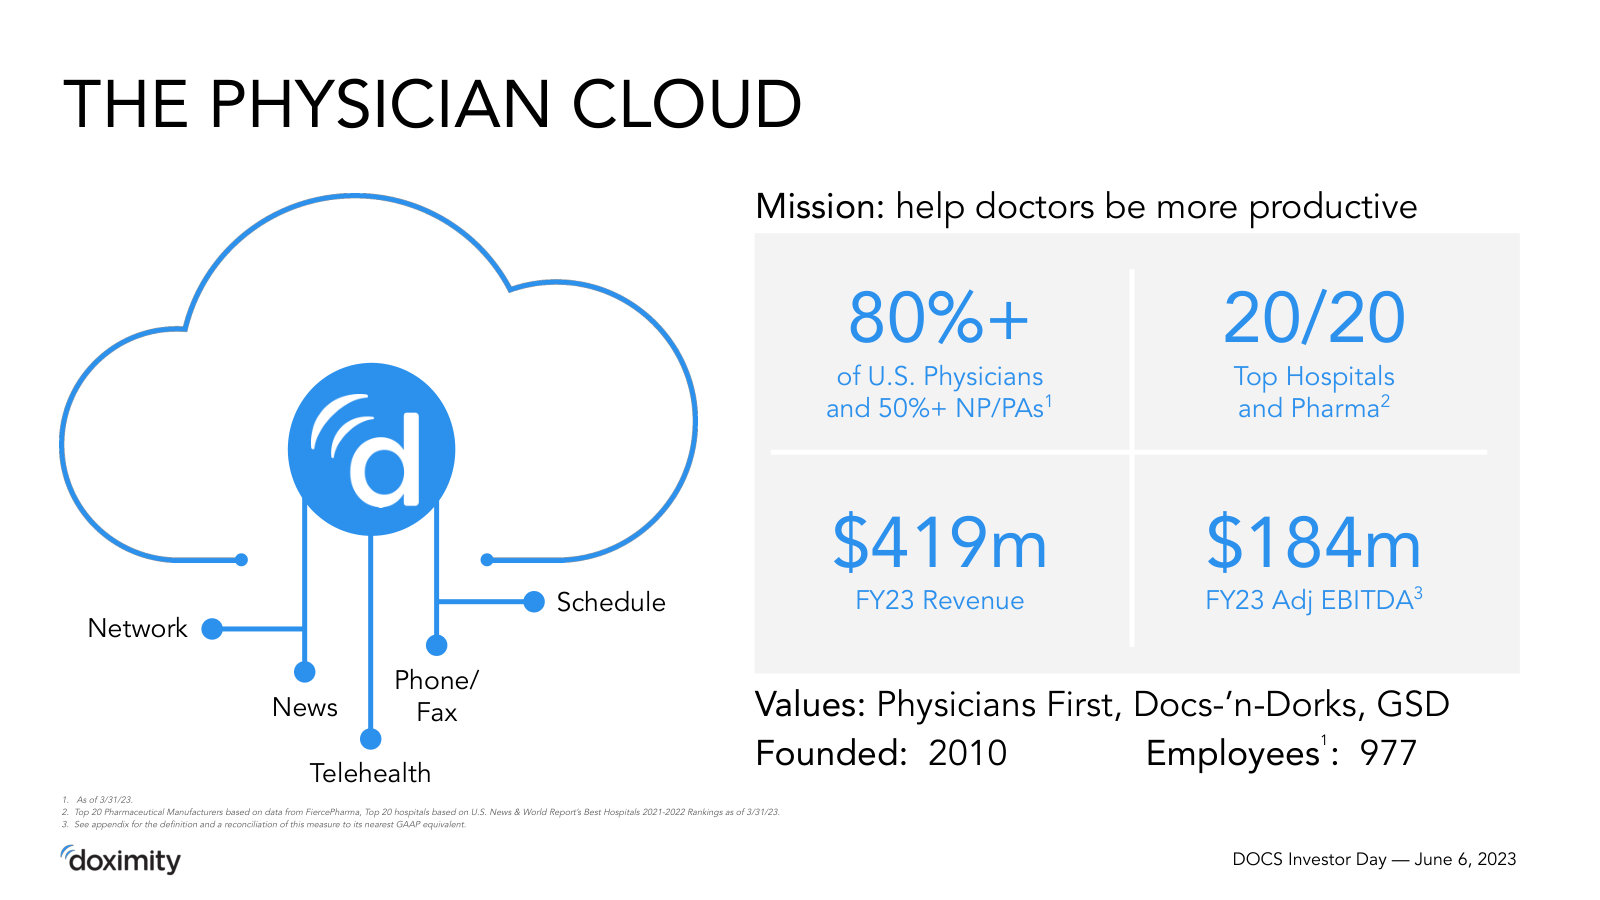
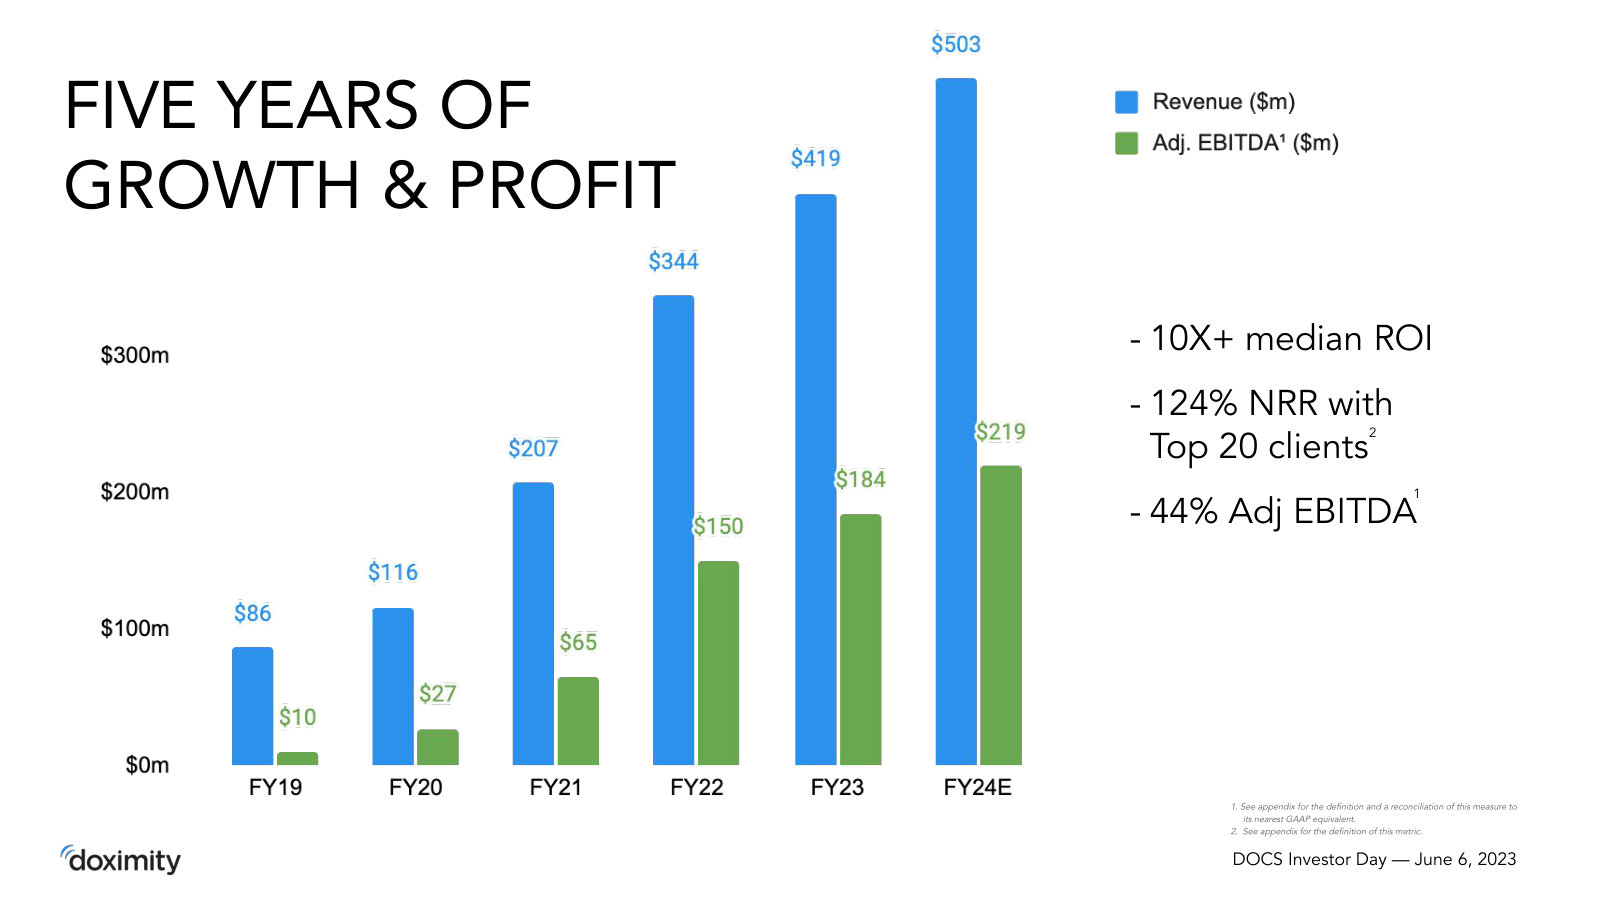
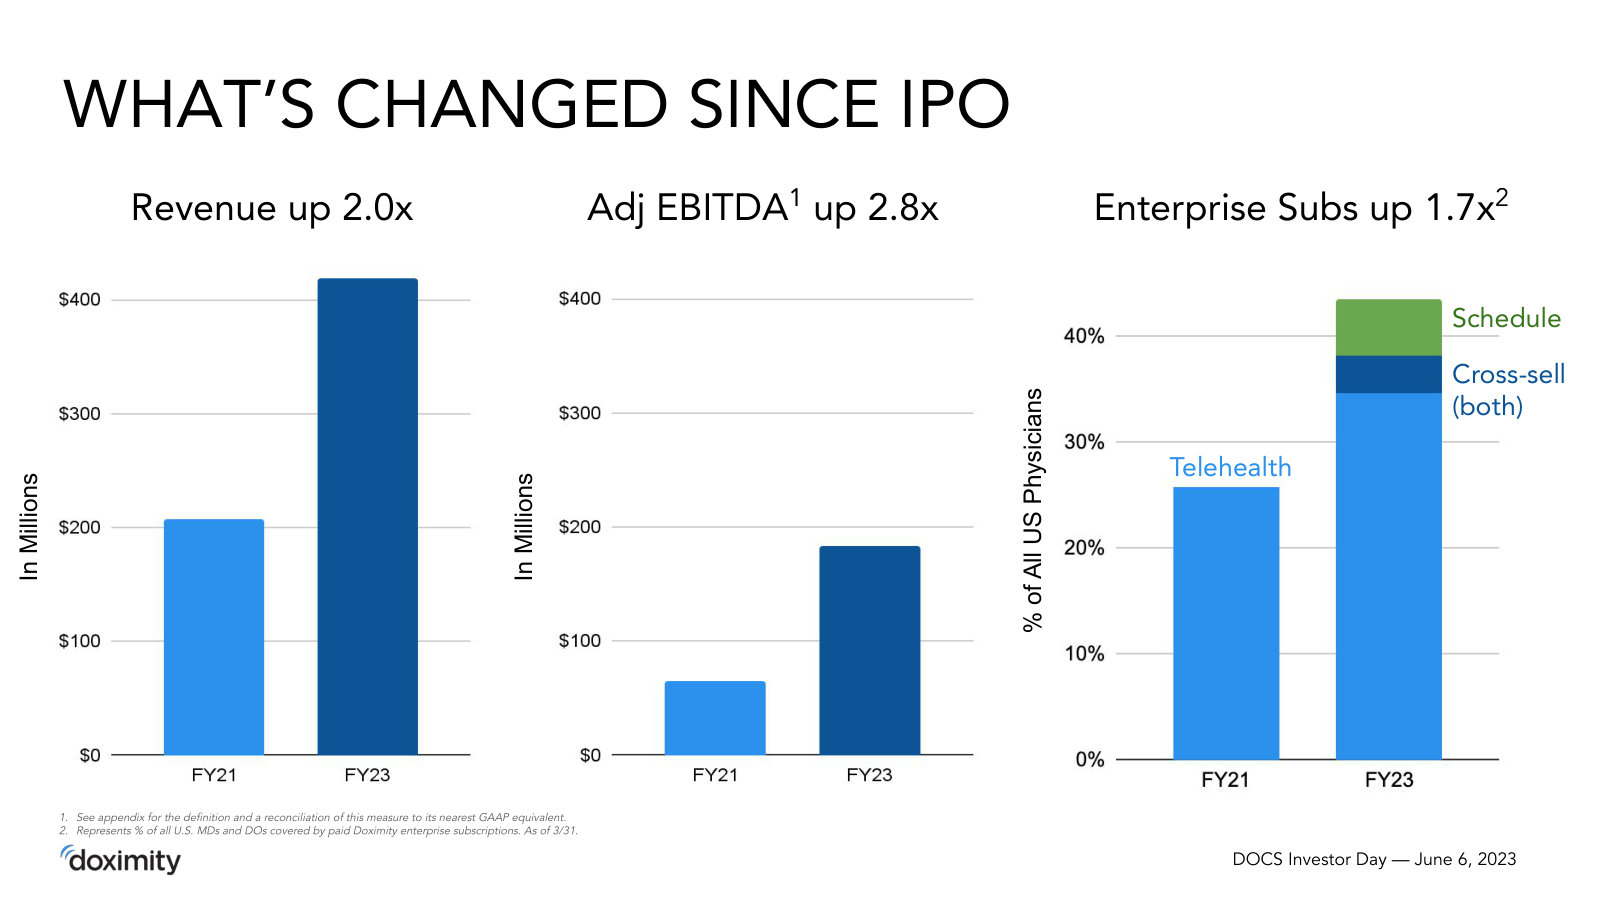
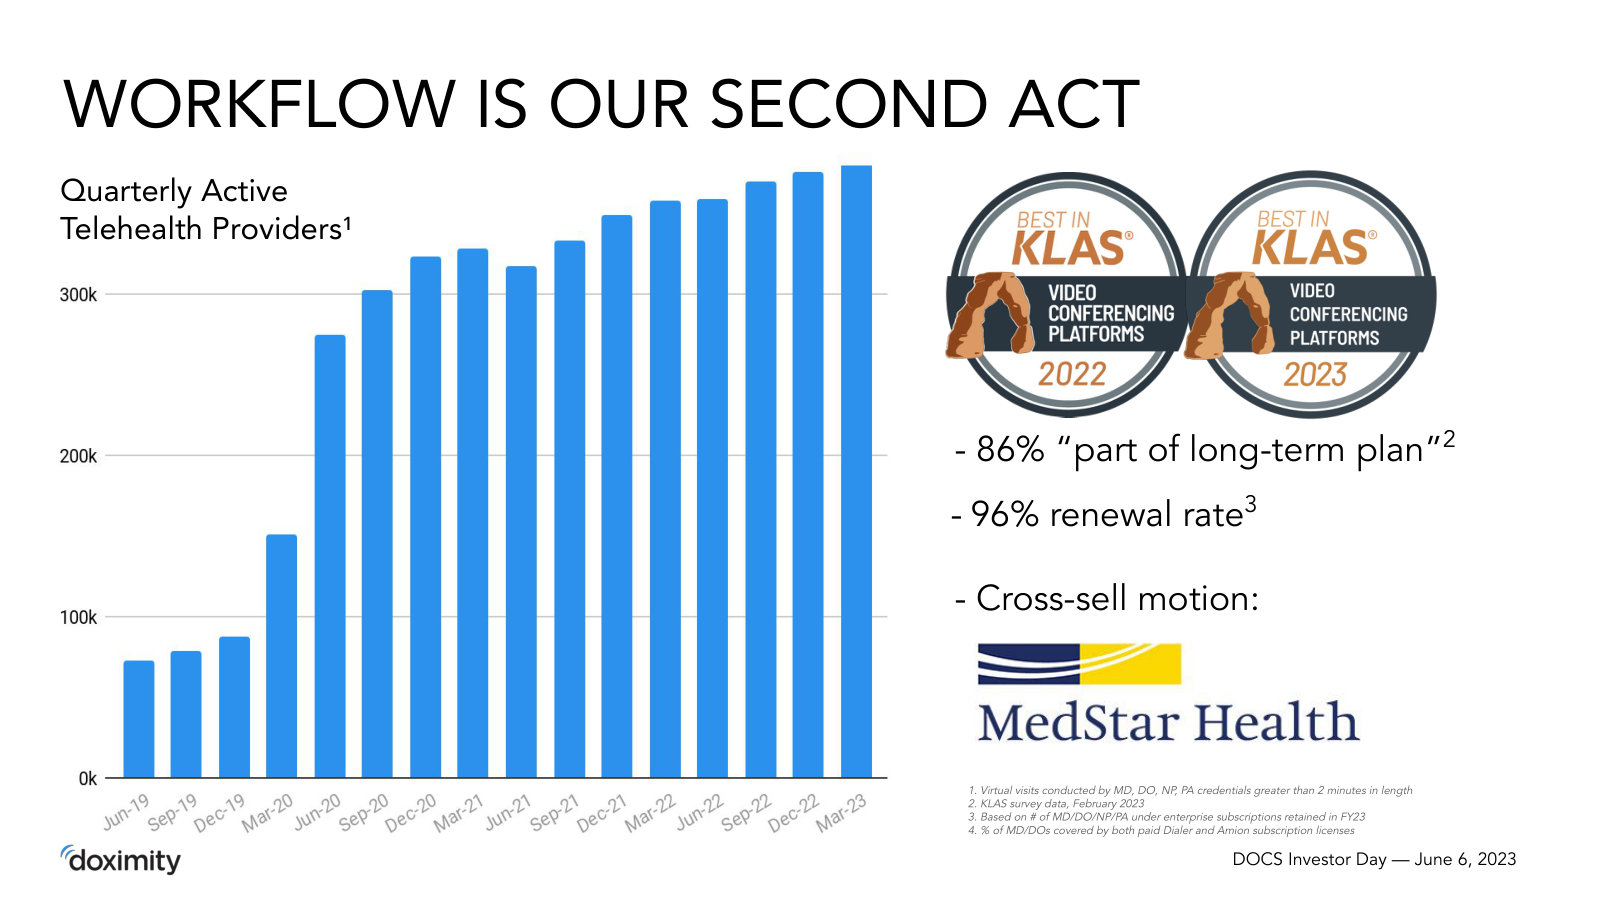
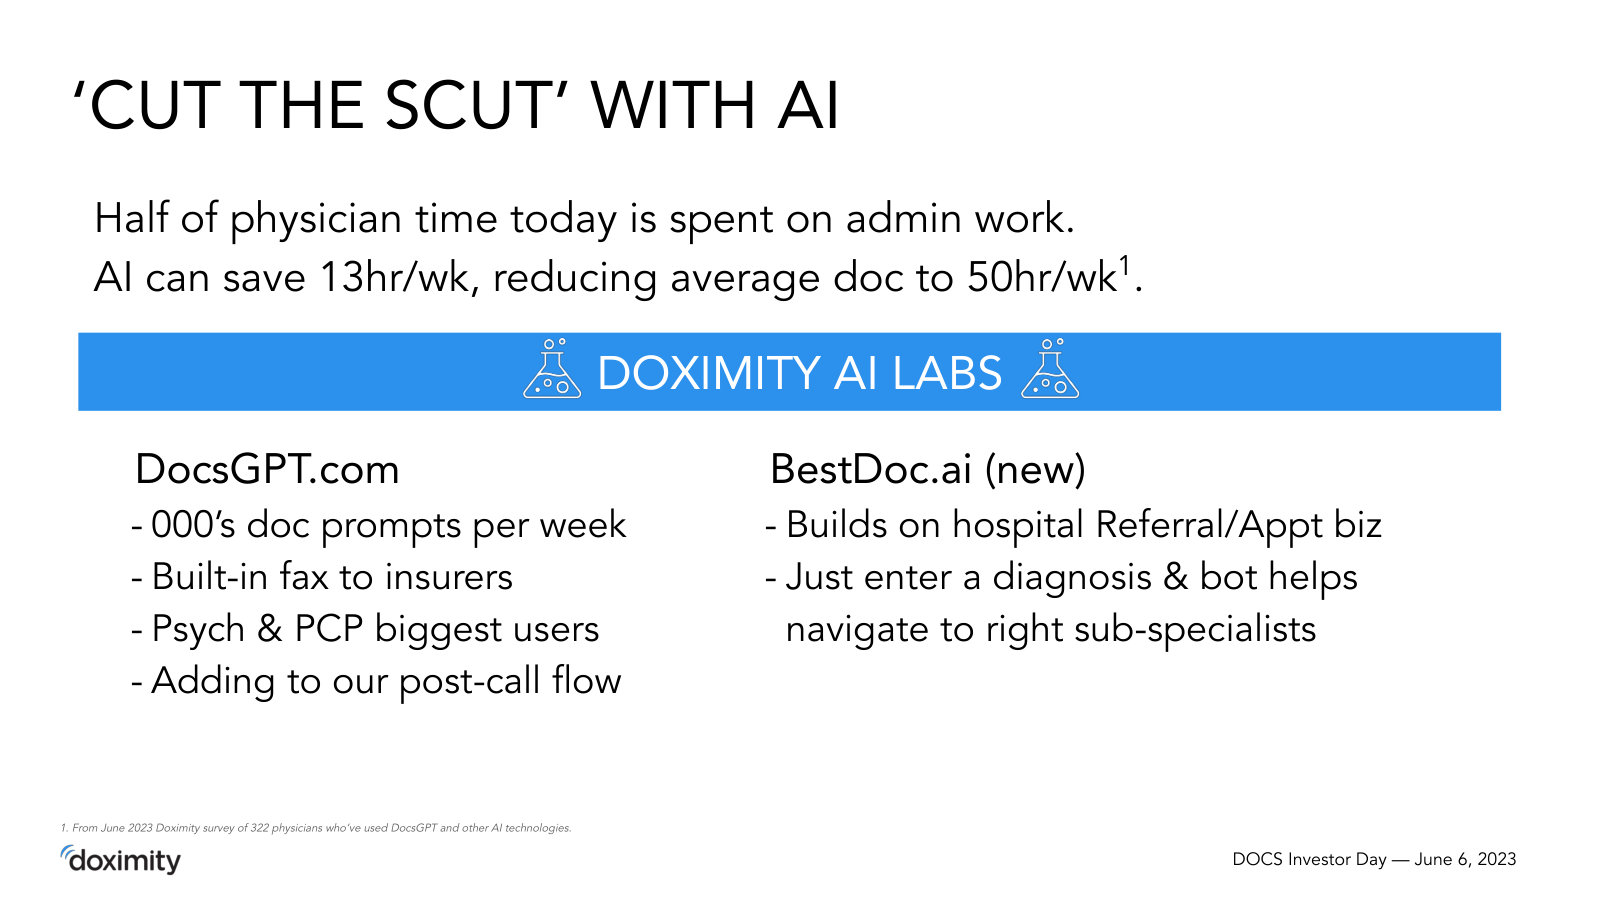
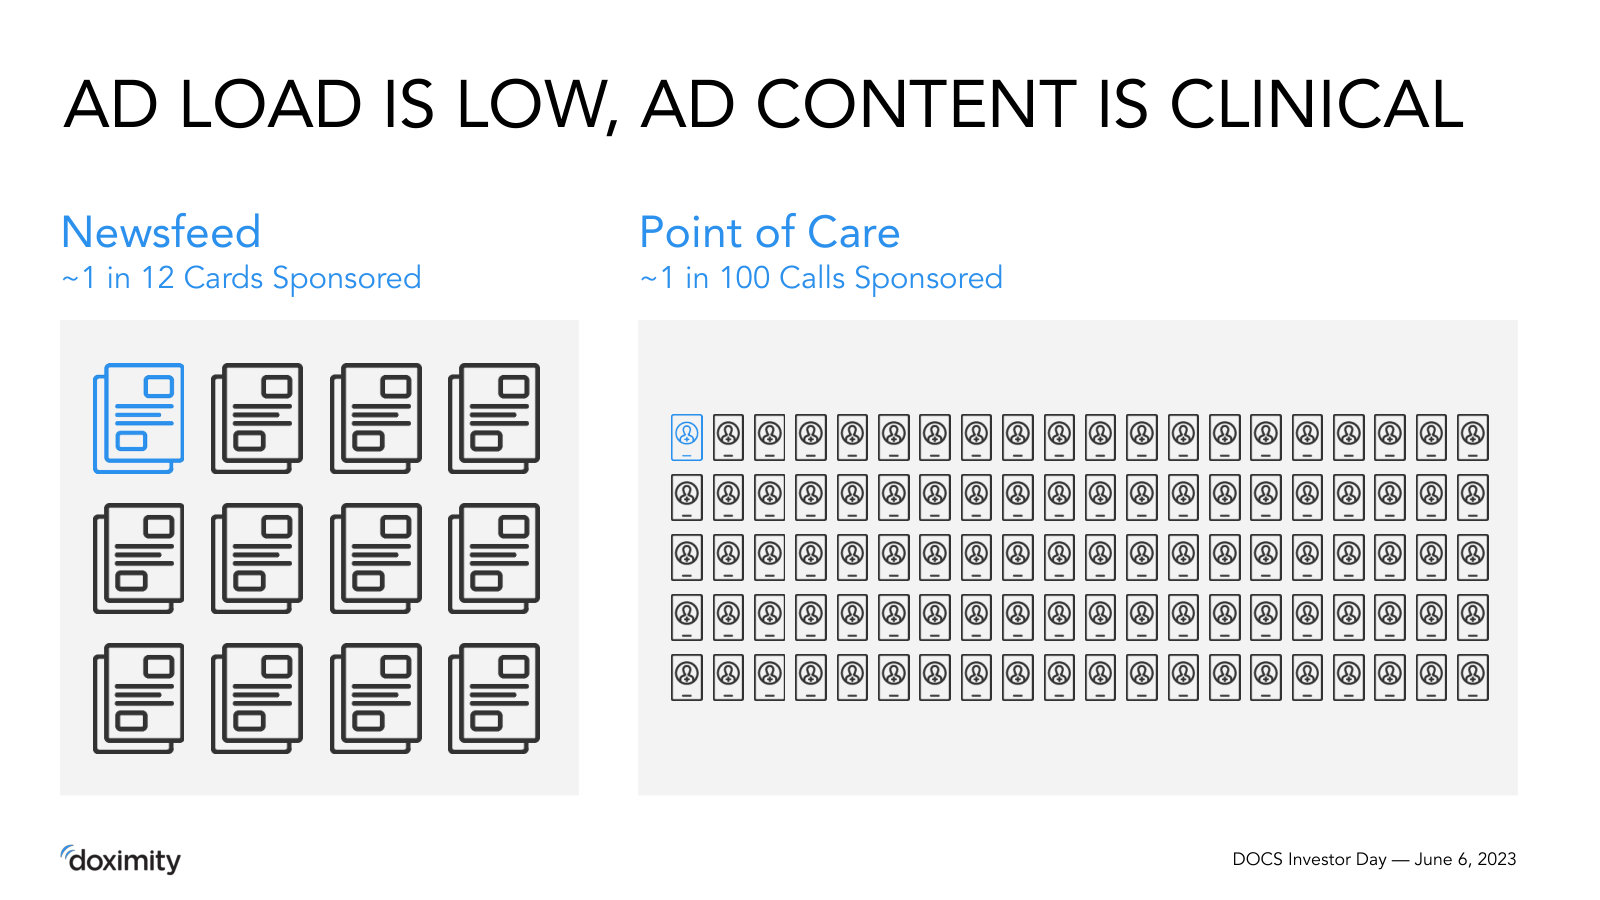
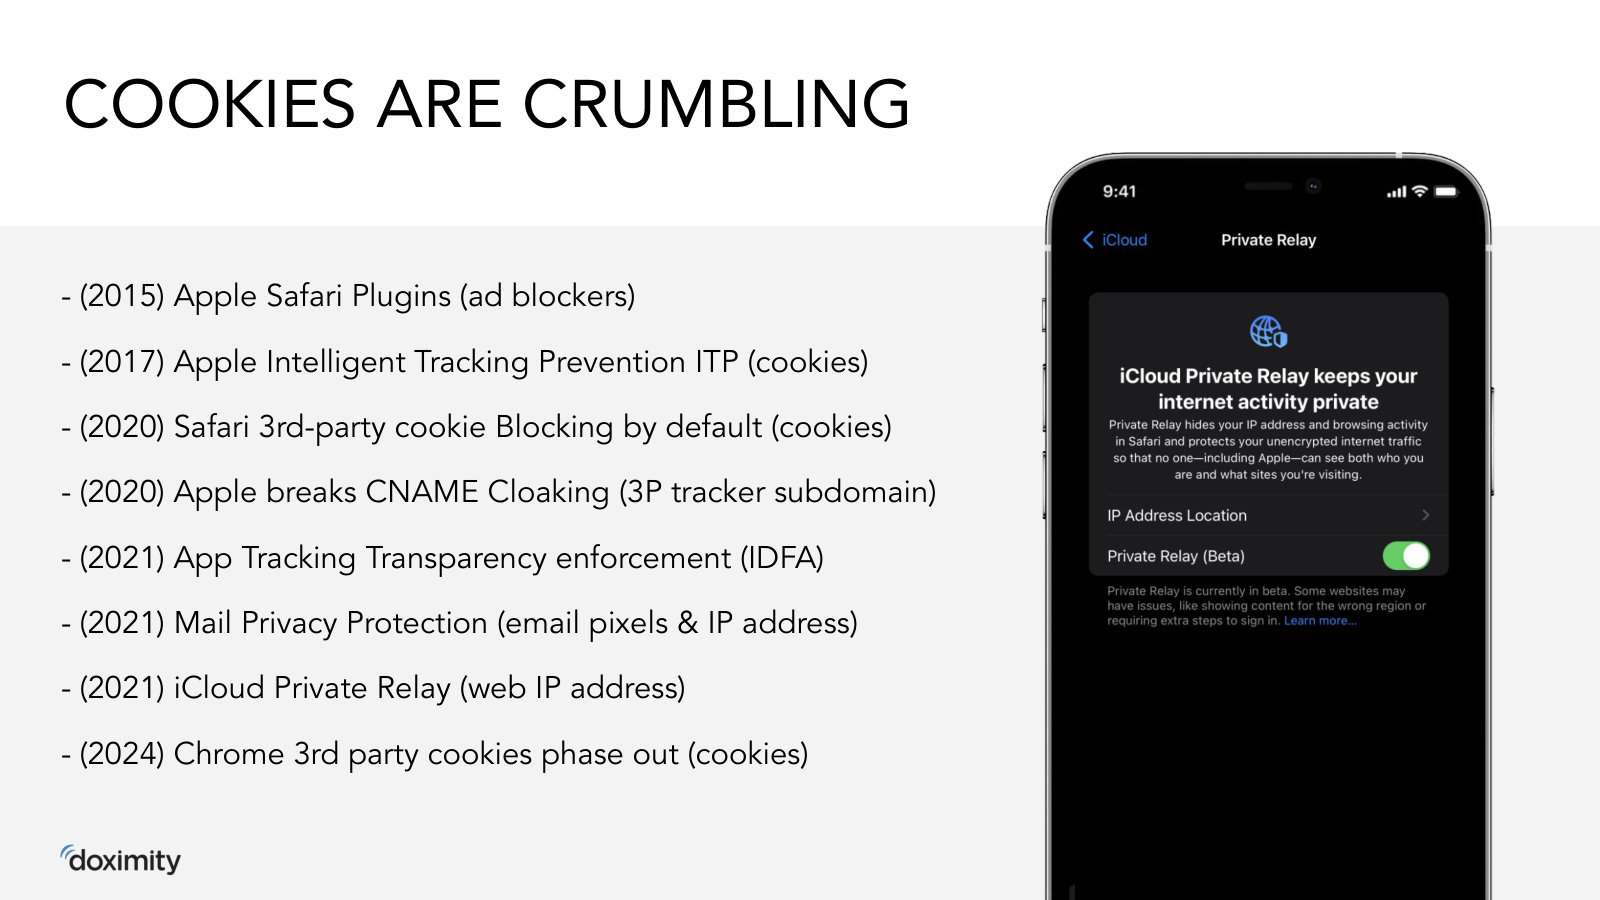
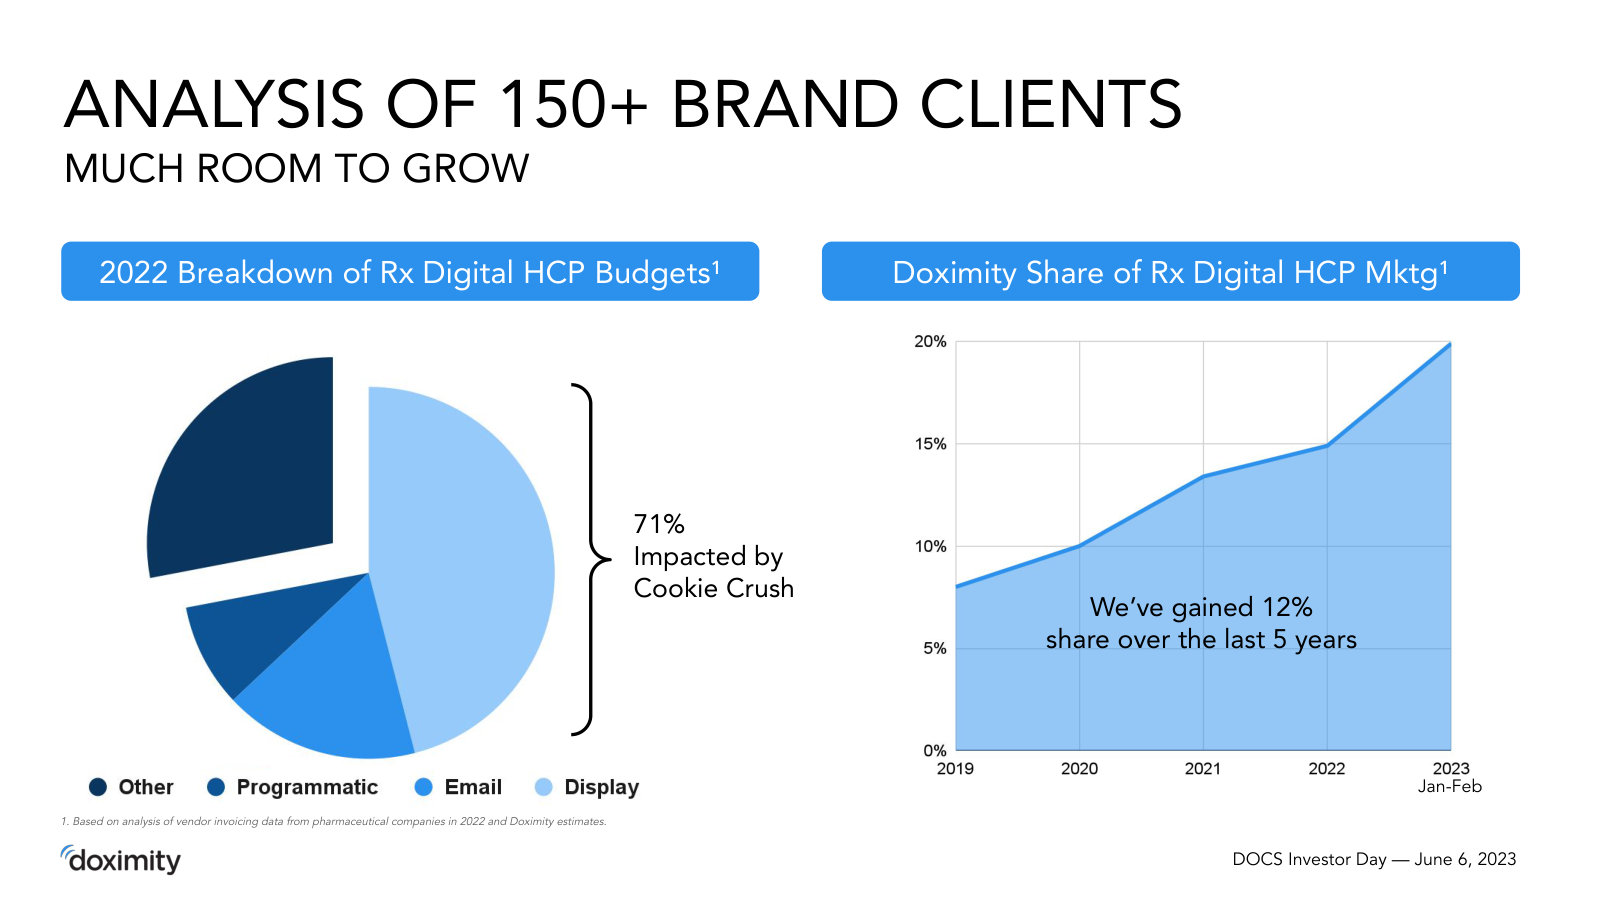
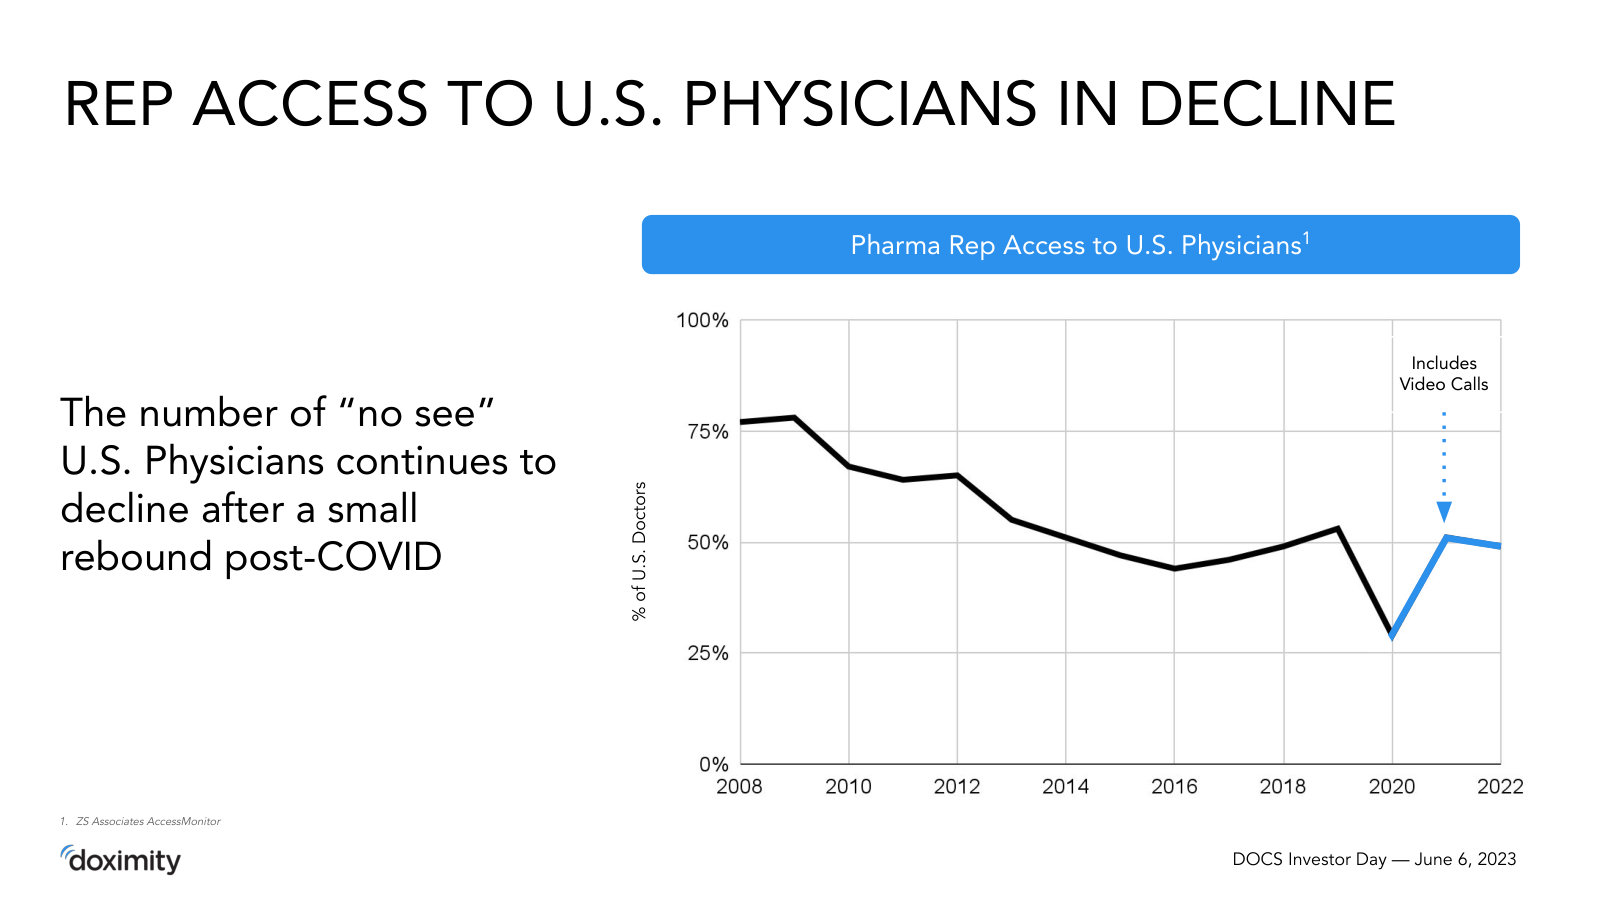
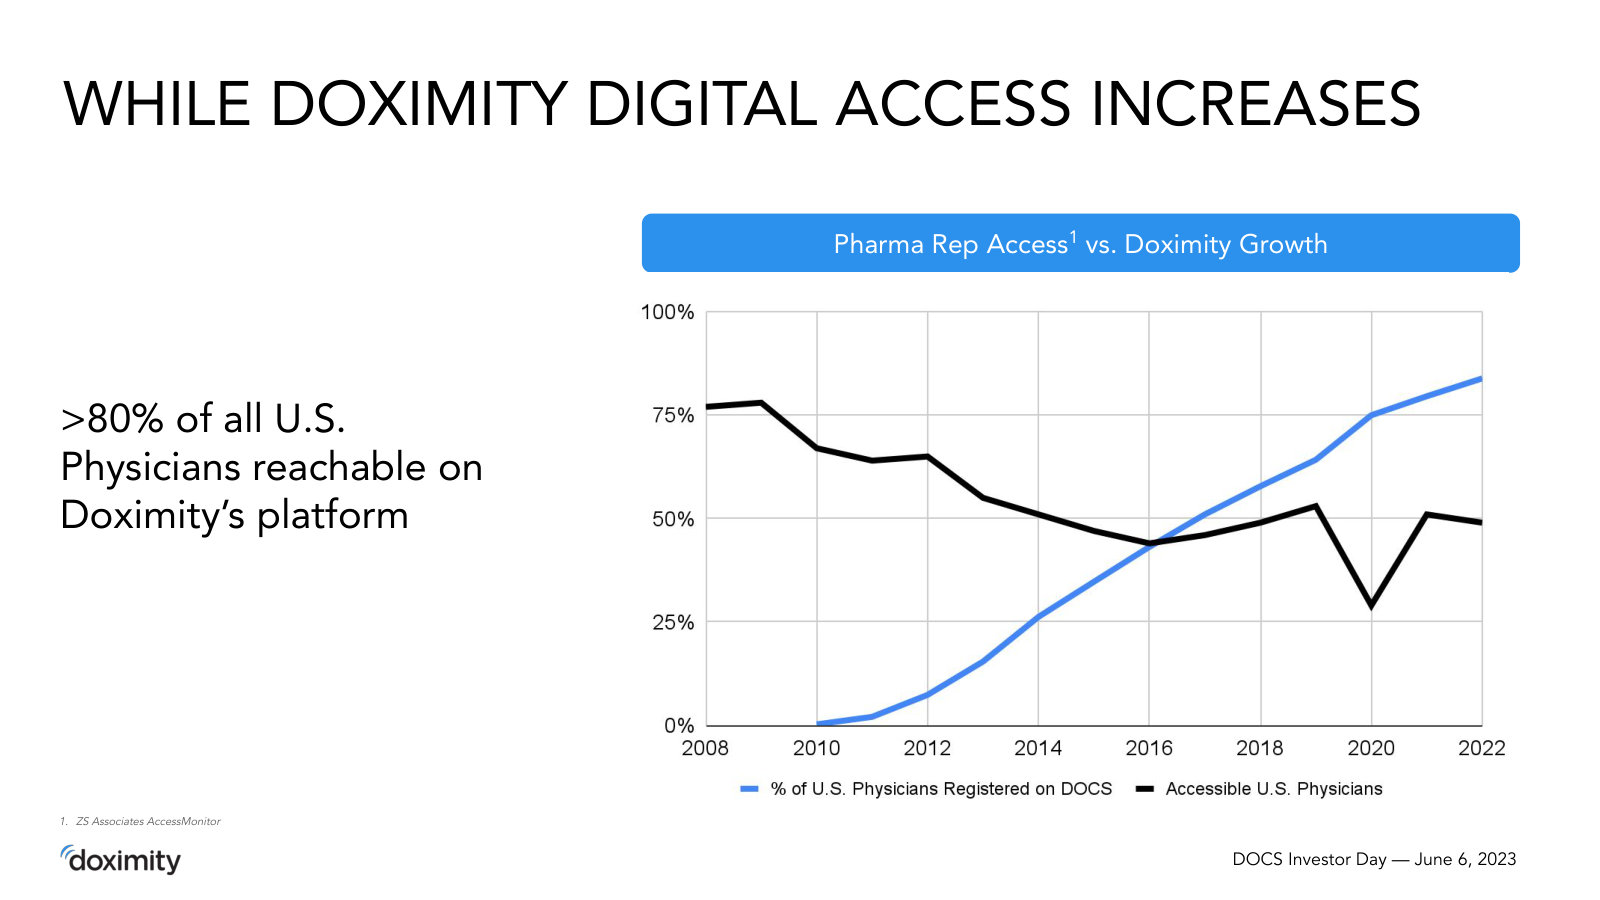
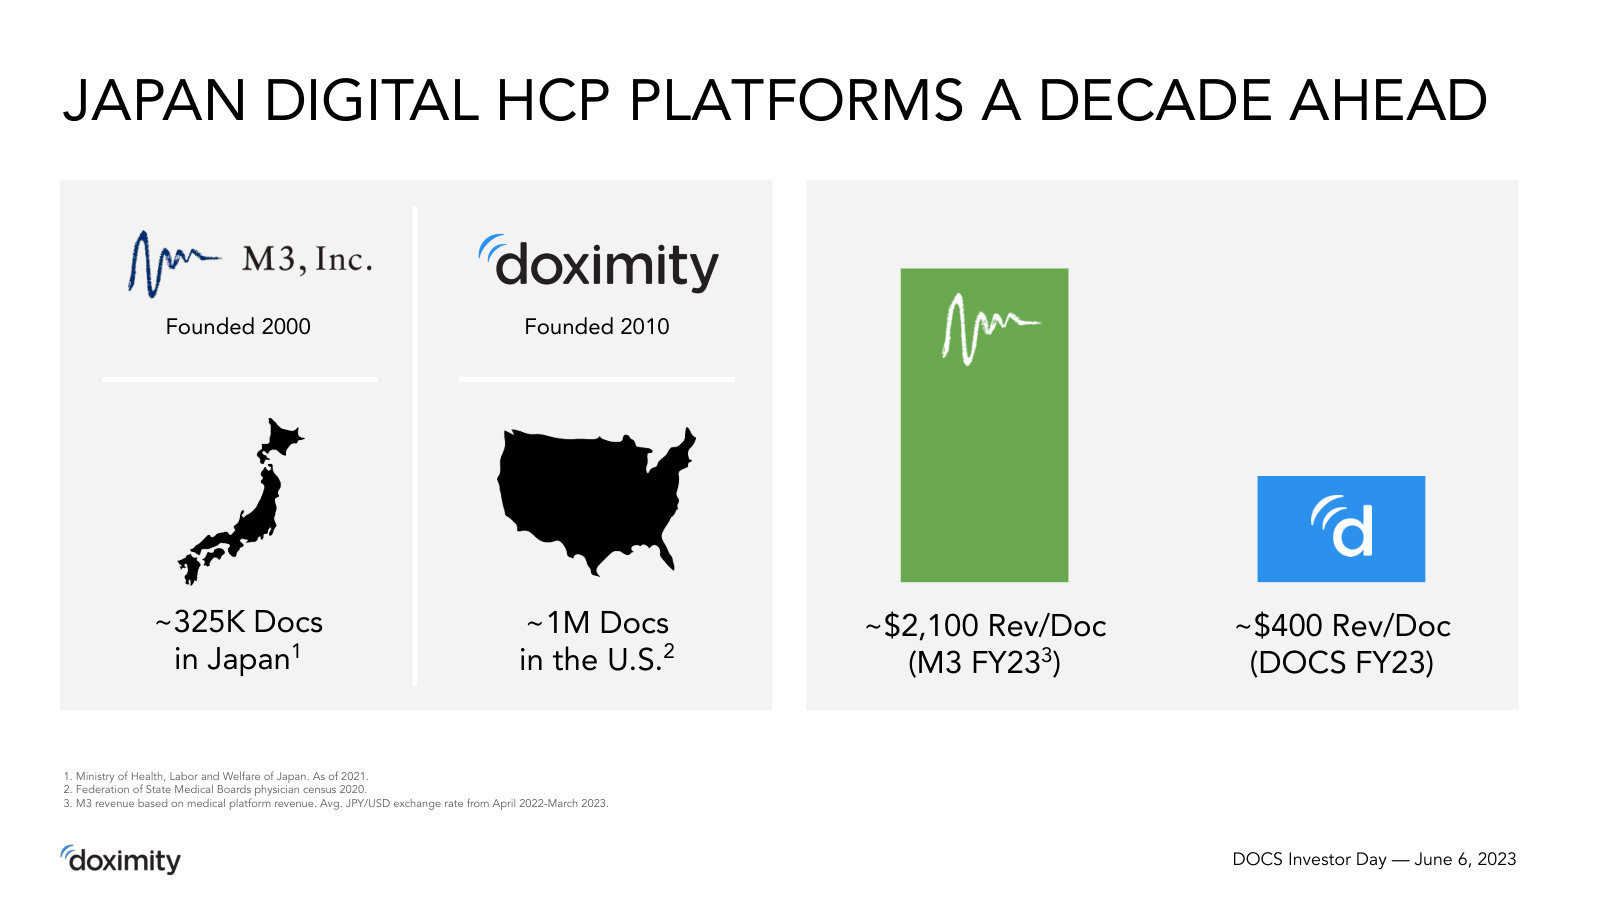
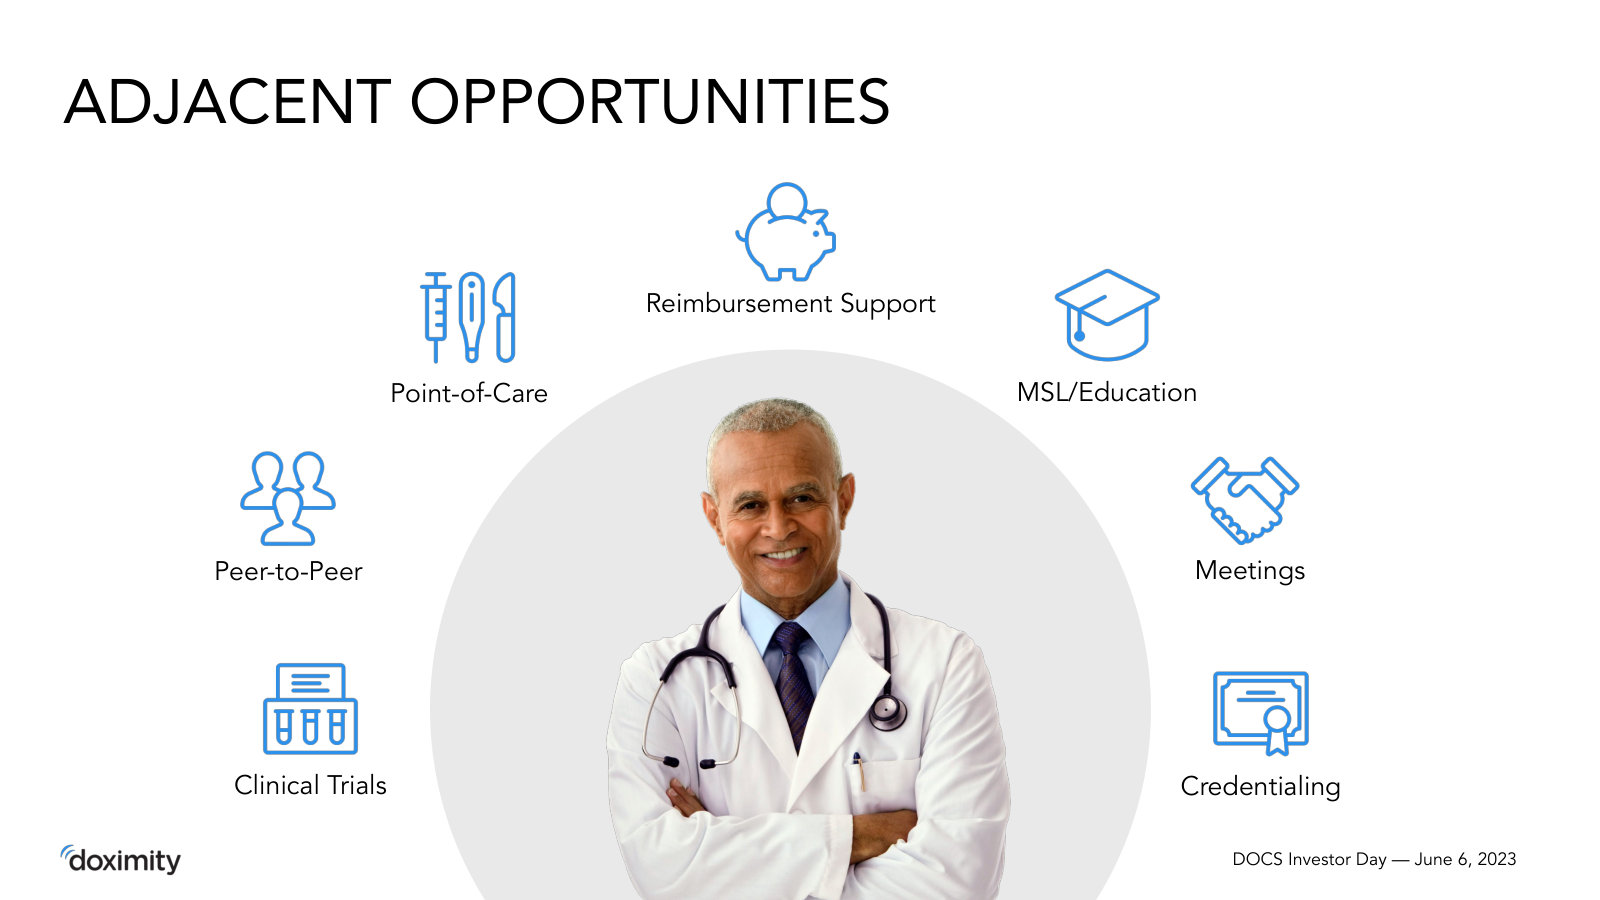
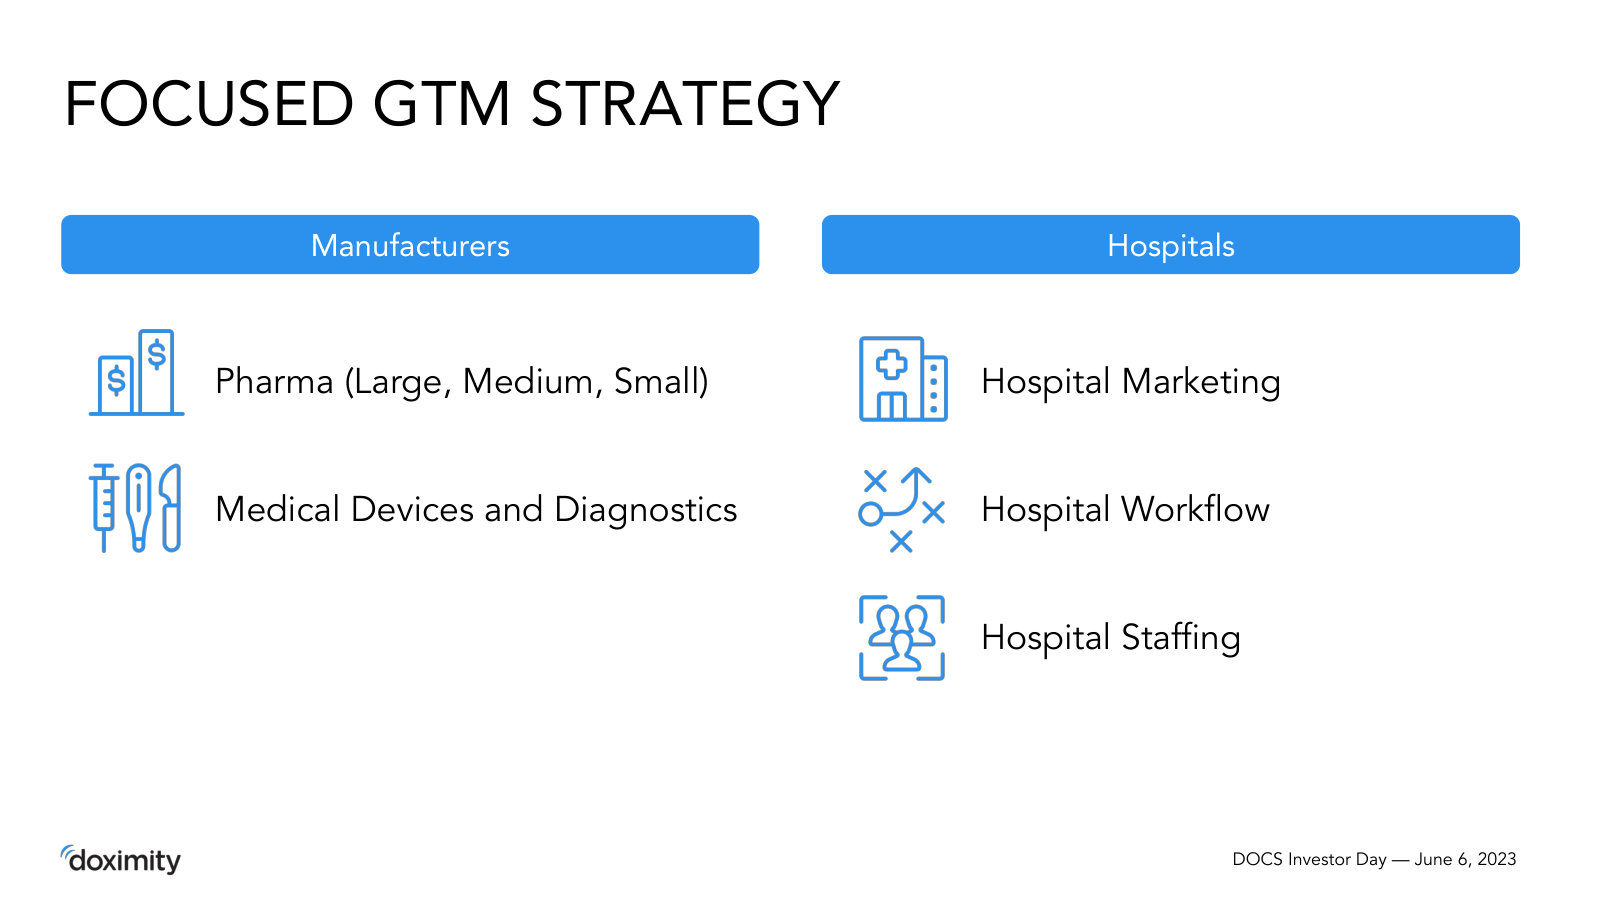
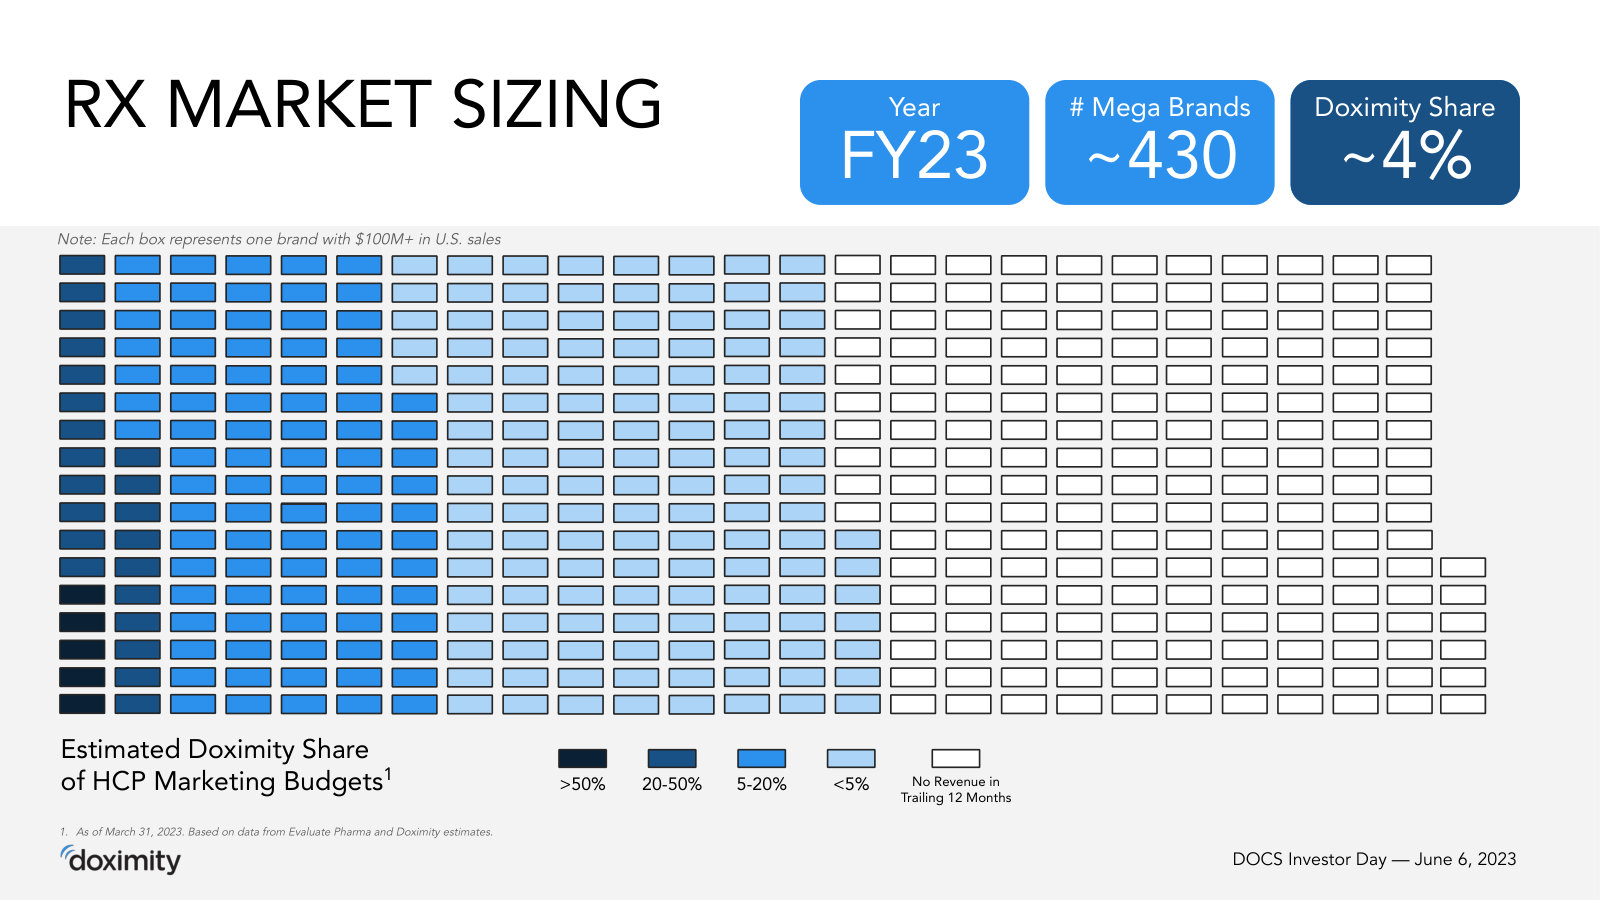
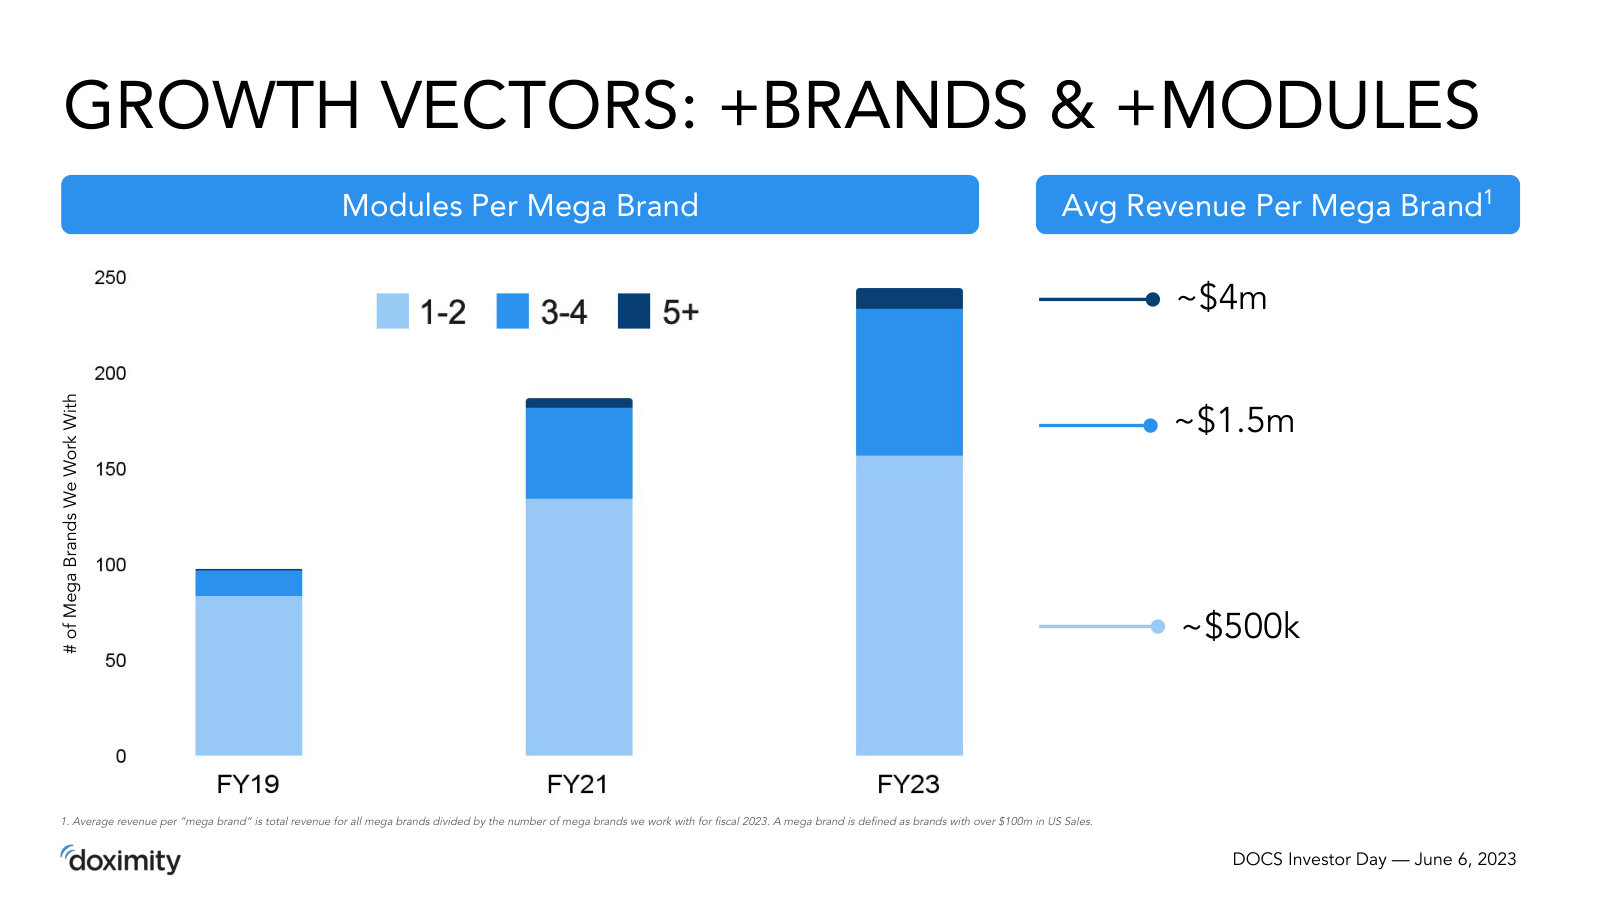
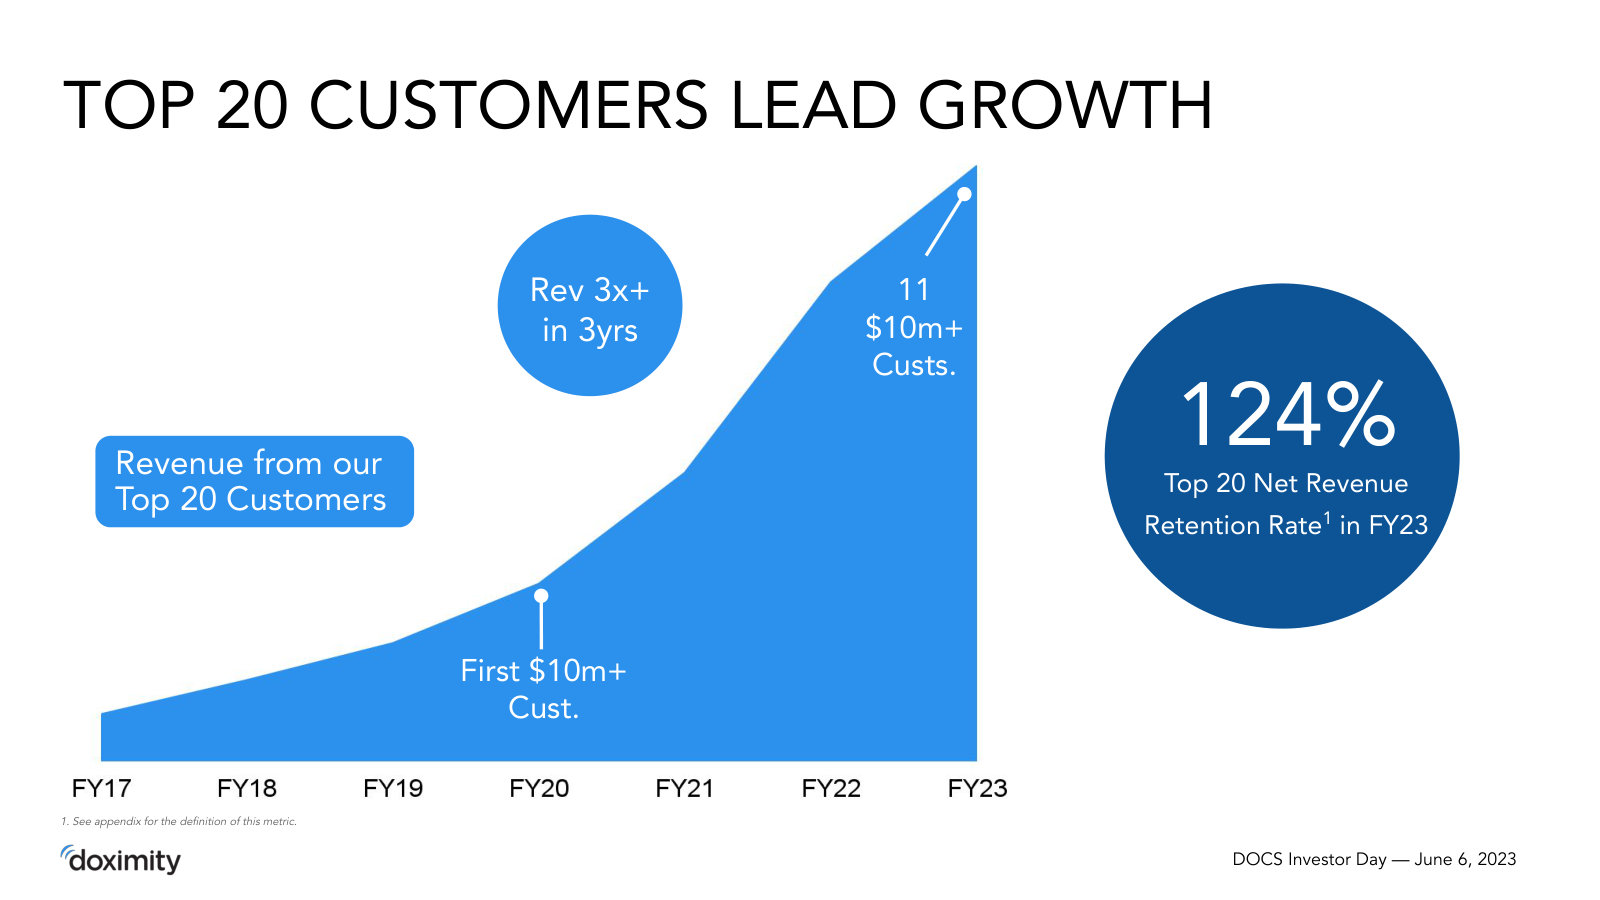
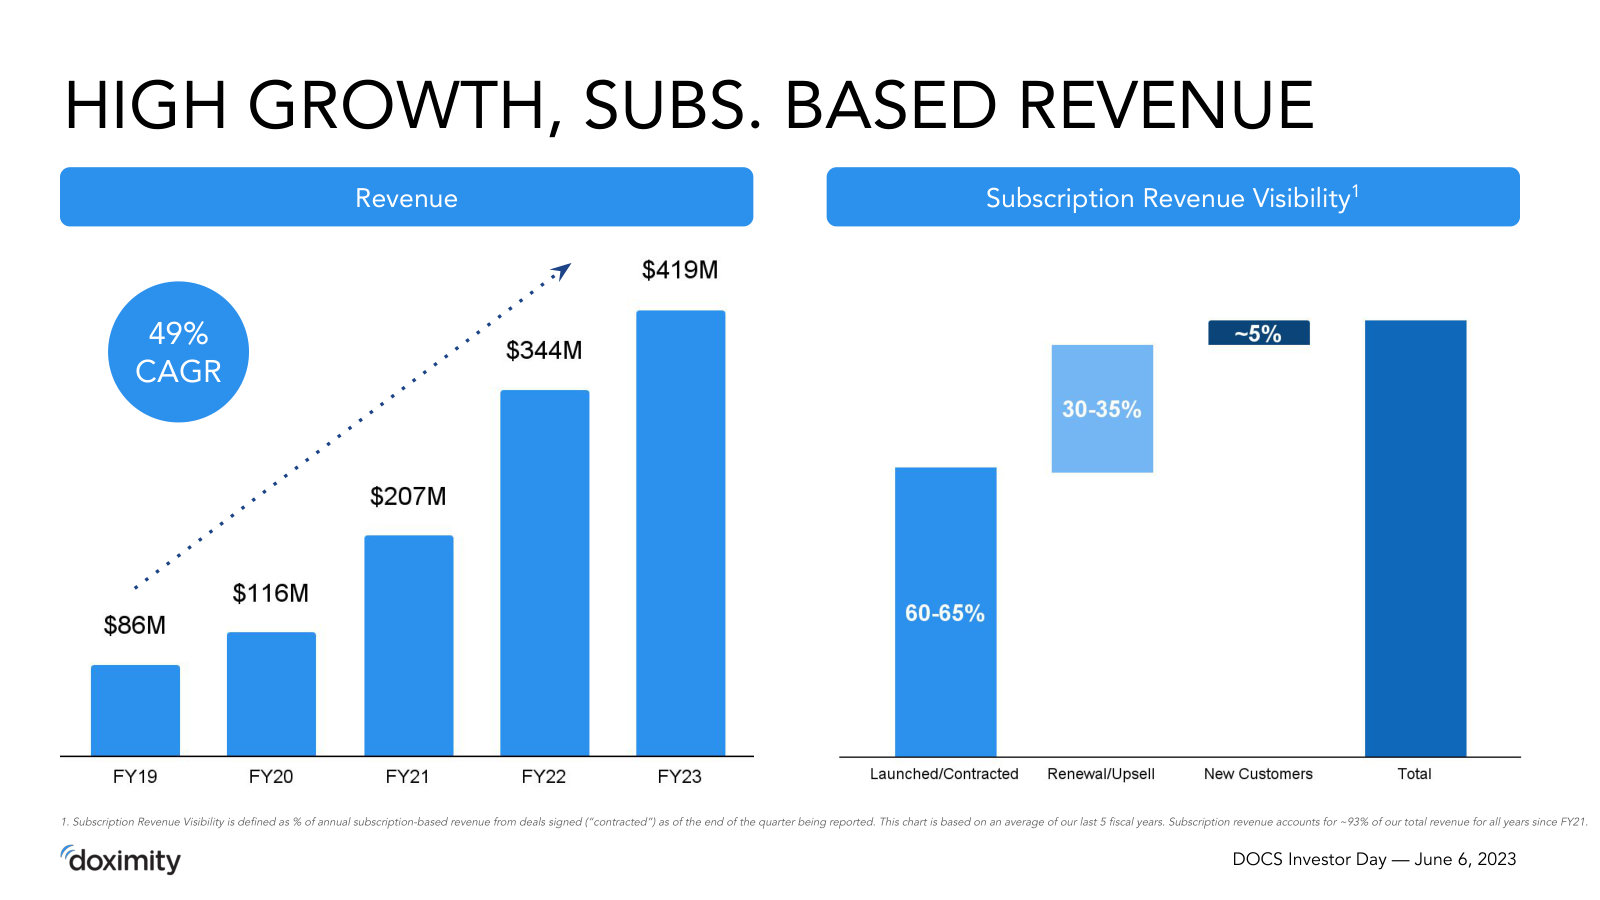
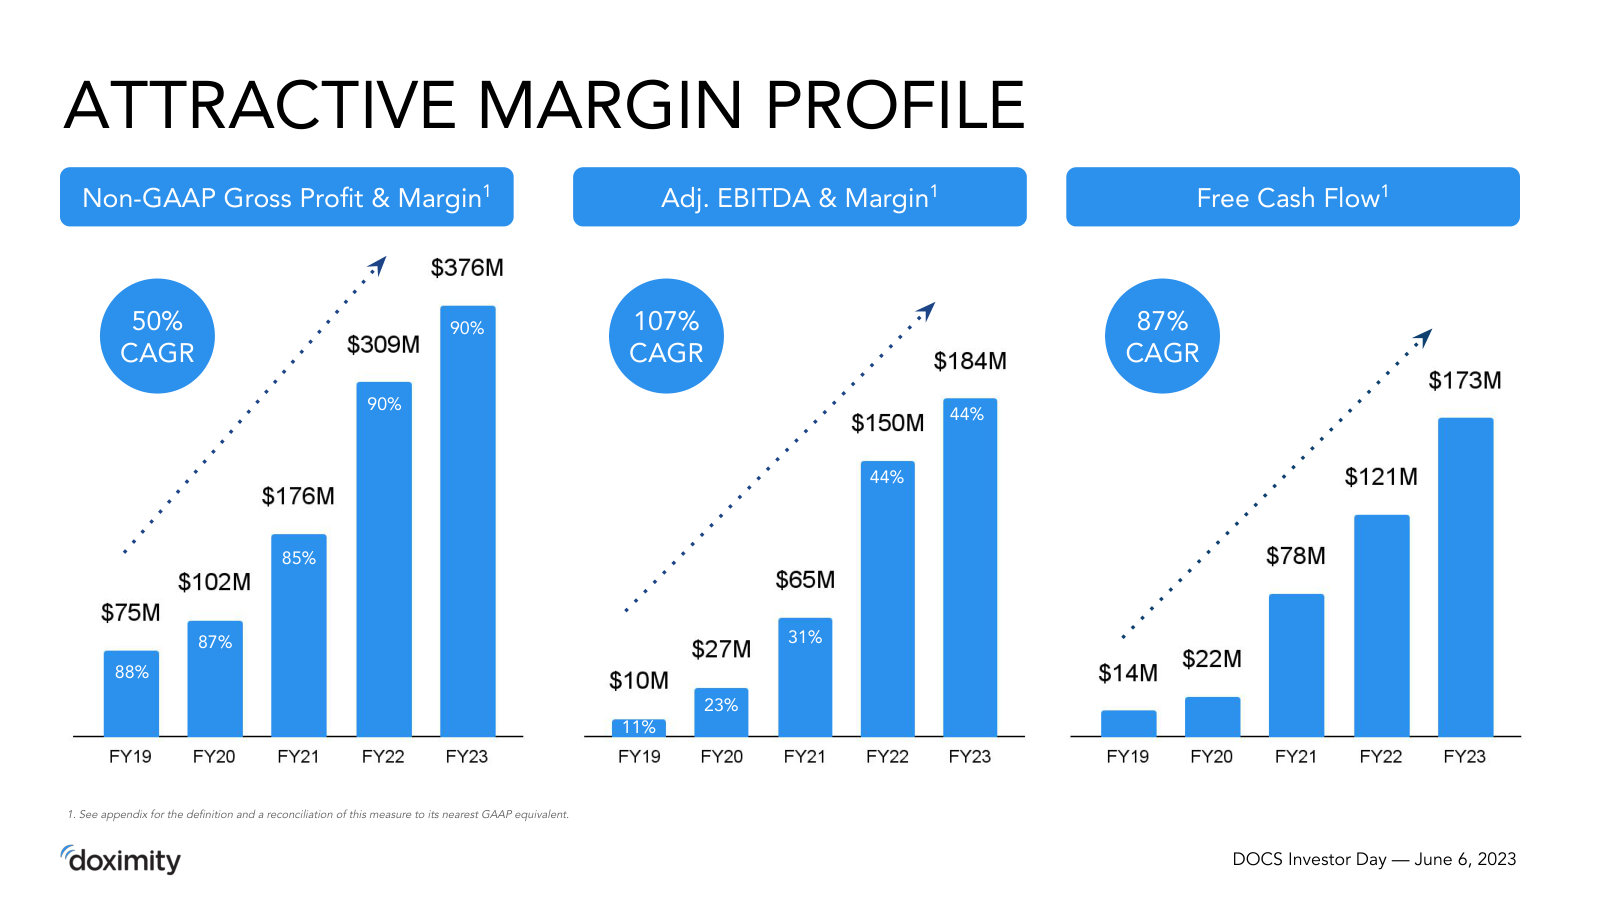
p. 5 — The whole company in one diagram — the 'physician cloud' of network, news, telehealth, fax and scheduling, with mission and key stats. · Open the full presentation →p. 7 — Five years of revenue and adjusted EBITDA, FY19–FY24E — the growth-with-profit profile that defines the equity story. · Open the full presentation →p. 8 — What changed since the 2021 IPO — revenue up 2x, adjusted EBITDA up 2.8x, enterprise subscriptions reaching more of the physician base. · Open the full presentation →p. 9 — Workflow as the 'second act' — active telehealth providers scaling since 2019, with a 96% renewal rate and Best-in-KLAS wins. · Open the full presentation →p. 11 — Where the AI story began — Doximity AI Labs and early tools (DocsGPT) framed as saving physicians ~13 hours a week. · Open the full presentation →p. 28 — Why the ad model is defensible — roughly 1 in 12 newsfeed cards and 1 in 100 calls are sponsored, and the content is clinical. · Open the full presentation →p. 29 — The industry tailwind — a decade of browser privacy changes eroding cookies and trackers, favoring Doximity's first-party reach. · Open the full presentation →p. 30 — The marketing opportunity sized — most Rx digital HCP budgets are exposed to the 'cookie crush,' and Doximity's share keeps climbing. · Open the full presentation →p. 32 — The structural problem for pharma — the share of U.S. physicians sales reps can no longer reach has fallen for over a decade. · Open the full presentation →p. 33 — Doximity's answer to that decline — the same chart with its own line: >80% of U.S. physicians now reachable digitally. · Open the full presentation →p. 34 — The bull-case analog — Japan's M3, a decade older, earns ~$2,100 per doctor vs Doximity's ~$400, framing the revenue runway. · Open the full presentation →p. 35 — Adjacent expansion surfaces — point-of-care, reimbursement, clinical trials, credentialing and more beyond today's core. · Open the full presentation →p. 36 — The two customer segments spelled out — manufacturers (pharma, devices) and hospitals (marketing, workflow, staffing). · Open the full presentation →p. 41 — How small the share still is — a grid of every >$100M pharma brand, with Doximity earning ~4% of HCP marketing budgets in FY23. · Open the full presentation →p. 42 — Two growth levers quantified — more mega-brands, and more modules per brand lifting average revenue from ~$500K toward ~$4M. · Open the full presentation →p. 43 — Customer concentration and stickiness — the top-20 customers lead growth at a 124% net revenue retention rate. · Open the full presentation →p. 44 — Revenue quality — a 49% five-year CAGR on subscription revenue, with 60–65% of a year's subscription revenue already contracted. · Open the full presentation →p. 45 — The full margin picture — non-GAAP gross margin ~90%, adjusted EBITDA margin scaling to 44%, and rising free cash flow. · Open the full presentation →